PV cleaning equipment manufacturer
PV cleaning equipment manufacturer

How Often Should You Clean Solar Panels? A Climate-Based Frequency Guide
Cleaning frequency depends on local soiling rate, not a calendar. Regional soiling data for the US and Europe, plus how to measure your own array.

The short answer
Cleaning frequency is a function of local soiling rate, not a fixed calendar interval. For most of the United States and Europe:
| Climate zone | Annual soiling loss (uncleaned) | Recommended cleaning |
|---|---|---|
| Humid, frequent rain — Pacific Northwest, UK, Ireland, Netherlands, Denmark | 1–3% | 0–1× per year, spot-clean only |
| Temperate / moderate — Northeast & Midwest US, Germany, France, Poland, Czechia | 3–6% | 1–2× per year |
| Dry or agricultural — Texas, California Central Valley, Spain, Italy, Portugal, Greece | 4–8% | 2–4× per year (roughly quarterly) |
| Desert / high dust — Southwest US, Almería, Sicily, Cyprus, interior Türkiye | 8–25% | Quarterly to monthly |
If your site falls in the lower half of that table, the question stops being “how often should I clean?” and becomes “how do I afford to clean that often?” That is an equipment and labour question, not a scheduling one — see section 5 below.
This article covers cadence only. For a general maintenance framework — soiling mechanics, method selection, and inspection routines — see our earlier guide, Practical Tips for Solar Panel Cleaning and Maintenance. That article is a broad best-practices overview; this one goes deep on scheduling and cost, and is intended to be read alongside it.
1. Why frequency is a climate question, not a calendar question
“Twice a year” is the industry’s default rule of thumb. It is an average across all climates, which makes it wrong in both directions for most individual sites.
Soiling accumulation is driven by five factors:
- Atmospheric dust load. Arid and semi-arid regions accumulate dust several times faster than humid ones.
- Rain frequency. Rain removes loose dust and little else — see section 3.
- Local sources. Agriculture, construction, unpaved roads, industrial emissions, and coastal salt spray all add residue that rain will not lift.
- Module tilt. Low tilt retains dust longer. Heavy soiling concentrates along the lower edge of each row.
- Dew and humidity. Overnight condensation cements dust into a film. This is the mechanism behind the cemented soiling discussed in section 2.
Two sites in the same country can legitimately require 0.5 and 4 cleanings per year — a spread of roughly 8×. That is why we recommend measuring rather than scheduling by habit, and why any single-number frequency recommendation should be treated with suspicion unless it states the climate it applies to.
2. Soiling rates by region
United States
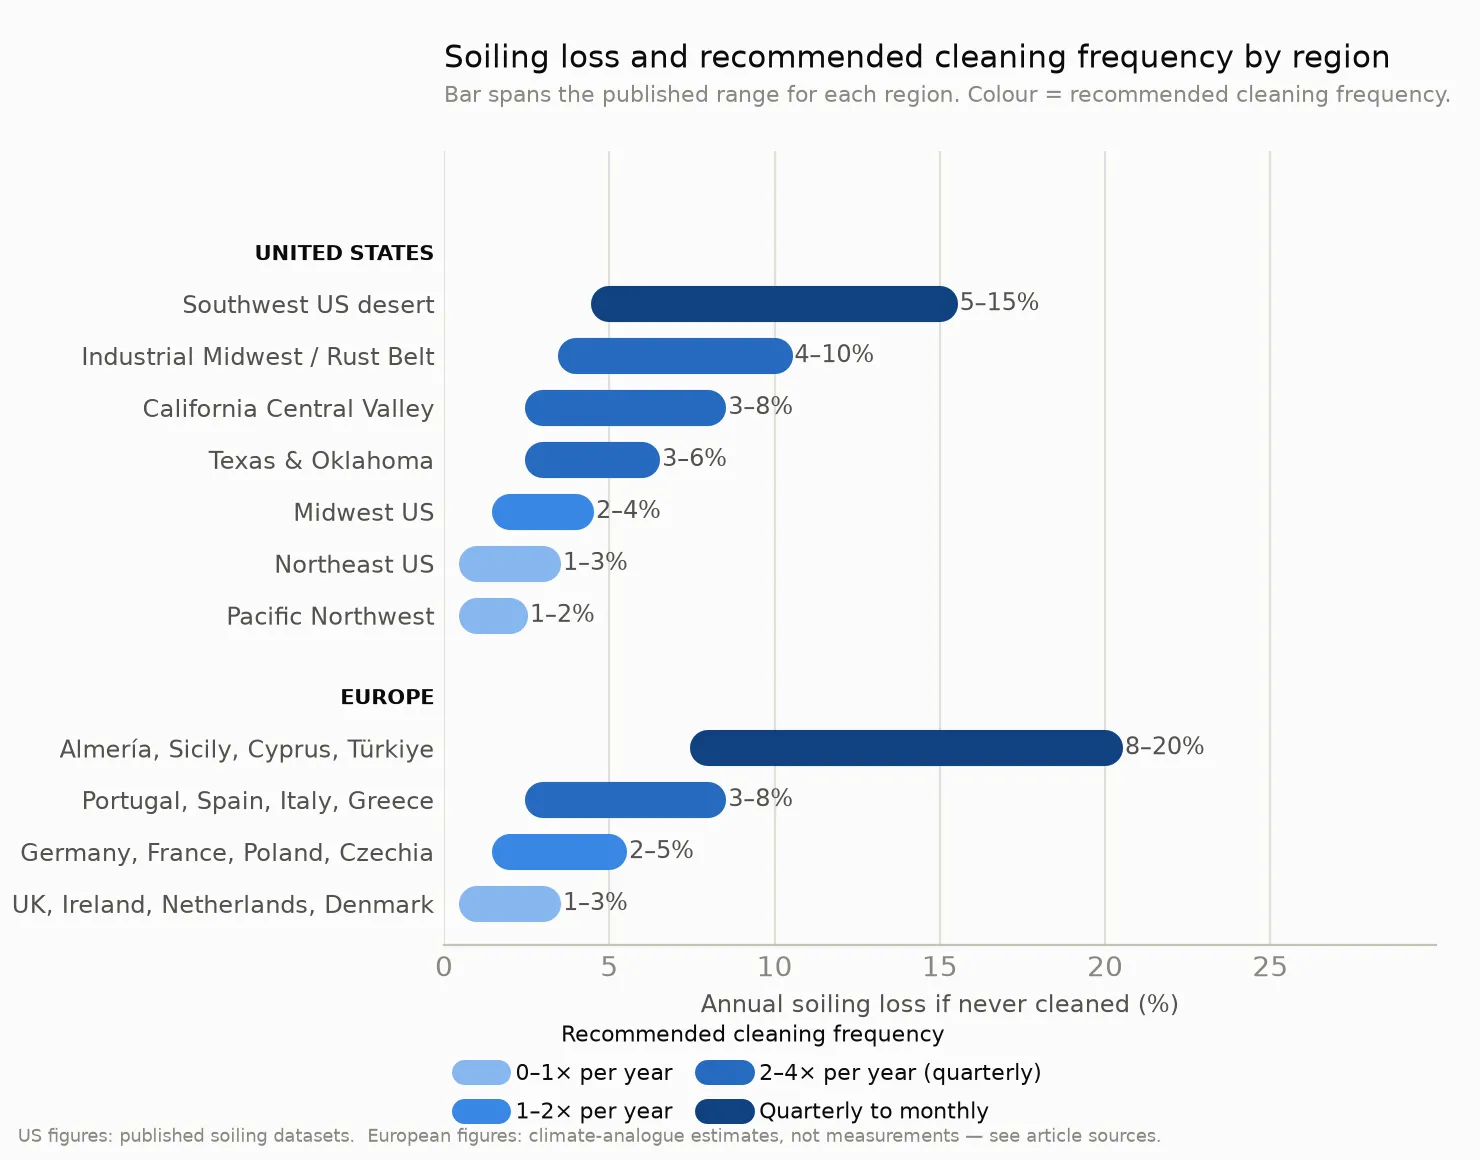
| Region | Monthly loss | Annual (uncleaned) |
|---|---|---|
| Pacific Northwest | 0.05–0.15% | 1–2% |
| Northeast US | 0.08–0.20% | 1–3% |
| Midwest US | 0.15–0.35% | 2–4% |
| Texas / Oklahoma | 0.20–0.50% | 3–6% |
| California Central Valley | 0.25–0.65% | 3–8% |
| Industrial / Rust Belt | 0.30–0.80% | 4–10% |
| Southwest US desert | 0.45–1.20% | 5–15% |
Europe
| Region | Estimated monthly loss | Estimated annual (uncleaned) |
|---|---|---|
| UK, Ireland, Netherlands, Denmark | 0.05–0.15% | 1–3% |
| Germany, France, Belgium, Poland, Czechia | 0.10–0.30% | 2–5% |
| Portugal, Spain, Italy, Greece, southern France | 0.25–0.70% | 3–8% |
| Almería, Sicily, Cyprus, interior Türkiye | 0.60–1.80% | 8–20% |
Methodological note — read this before citing the European figures. The US monthly figures are drawn from published soiling and cleaning-economics datasets (see Sources). The European figures are climate-analogue estimates, produced by mapping each region onto the closest measured climate band, because site-level soiling data is far less publicly available in Europe than in the US. We publish them as estimates, not measurements, and we will replace them with measured values as we obtain them. If you operate in Europe and have measured data, we would like to hear from you.
Reference points outside these markets
| Region | Monthly loss | Annual (uncleaned) |
|---|---|---|
| Northern India | 0.70–1.50% | 8–18% |
| Middle East / North Africa | 0.80–2.50% | 10–25% |
Reconciling the ranges you will see elsewhere
Published soiling-loss figures vary widely — you will see 2%, you will see 30%, and both may be correct. The apparent contradiction comes from three different measurement bases:
- Time-based (the tables above) — loss accumulated over a period under local conditions.
- Density-based (the table below) — loss as a function of how much dust is actually on the glass.
- Event-based — loss measured immediately after a discrete event such as a dust storm.
| Dust density | Power loss |
|---|---|
| 0.1 mg/cm² | 2–3% |
| 0.5 mg/cm² | 6–9% |
| 1.0 mg/cm² | 11–15% |
| 2.0 mg/cm² | 18–24% |
| 5.0+ mg/cm² | 30–45% |
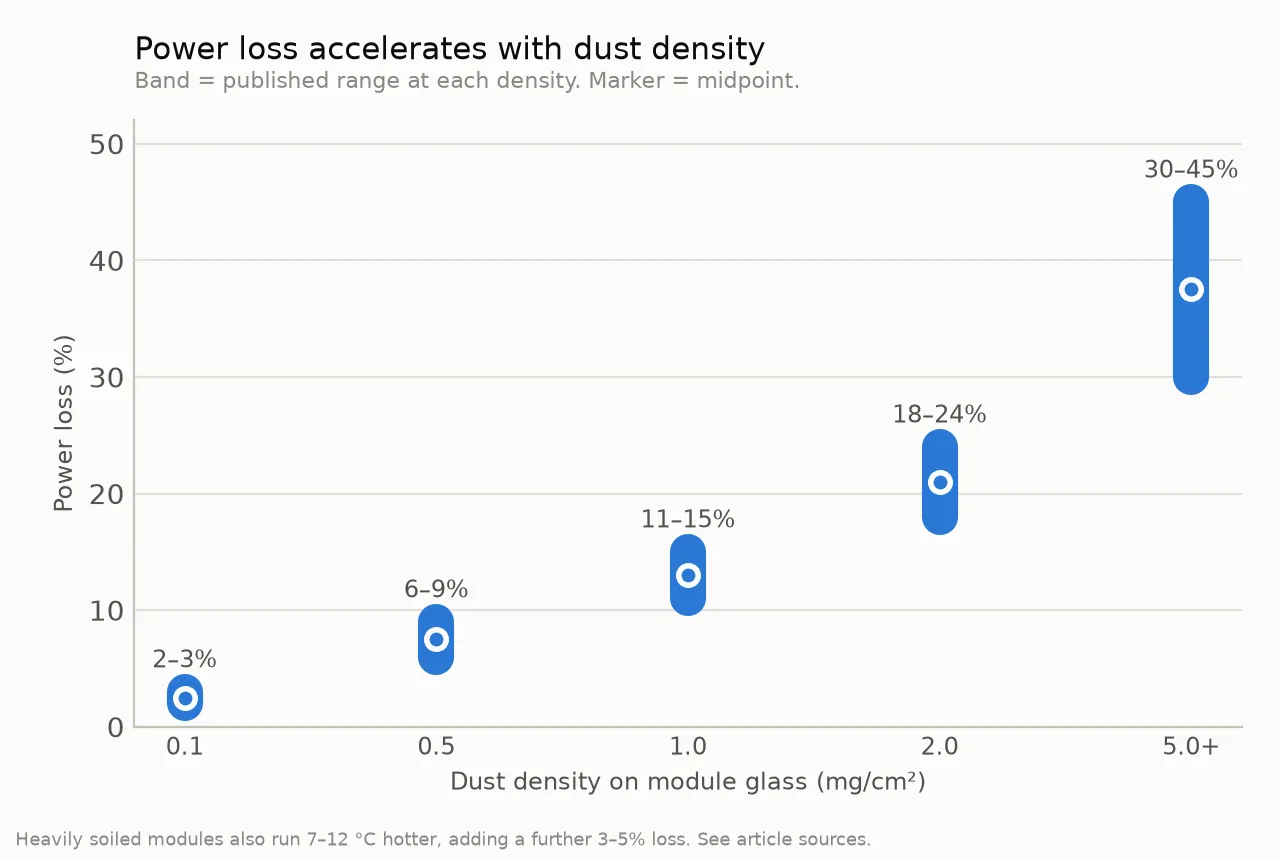
The low single-digit percentages describe lightly soiled arrays in temperate climates. The 20–30% figures that circulate for “dirty panels” describe heavy, prolonged accumulation or post-storm conditions. Both are describing real states — they are just not the same state. When you compare sources, check which basis is being used before concluding that one of them is wrong.
Secondary thermal effect. Heavily soiled modules run 7–12 °C hotter than clean ones, which adds a further 3–5% efficiency loss on top of the optical loss. Soiling costs you twice: less light reaches the cell, and the cell converts what does arrive less efficiently.
3. Why rain is not a cleaning strategy
Rain removes an estimated 40–75% of loose dust, and almost none of the residue that drives the larger losses:
- Pollen — adhesive and seasonal; largely rain-resistant once dried.
- Bird droppings — acidic, and capable of etching the anti-reflective coating if left in place.
- Soot and diesel particulate — oily; binds to glass.
- Cemented dust — dust that has cycled repeatedly through dew and drying, forming a chemically bonded film rather than a loose layer. Cemented soiling in hyper-arid regions has been measured at up to 9.8% annual energy loss.
Rain also creates a failure mode of its own. On a partially soiled array, rain can wash dust into streaks and concentrate it along the lower edge of each row. Because that produces non-uniform soiling, the result is not merely a proportional output loss — it is cell mismatch and, in the worst case, hot spots.
The “self-cleaning array” idea holds only in climates with frequent, heavy rain and low dust load — roughly the first row of the table in section 2. Everywhere else, rain is a partial credit at best, and a reason to inspect rather than a reason to skip cleaning.
4. How to tell whether your own array needs cleaning
Three methods, in increasing order of usefulness.
Method 1 — Visual inspection
Cheapest and least reliable. You can see bird droppings and heavy dust. You cannot see the 3–5% film that accumulates before soiling becomes obvious — by which point you have already lost weeks of production.
Method 2 — Output comparison
Compare current production against a known-clean baseline at equivalent irradiance and temperature. Reliable only when irradiance is normalised. See the warning in section 6 — this is the single most common source of bad cleaning data.
Method 3 — In-line soiling sensor
An optical-scattering sensor mounted at module plane continuously reports how clean the glass is, and can trigger cleaning automatically when a threshold is crossed. This is the only method that scales: it removes guesswork, produces a time-stamped record, and lets you clean on condition rather than on a calendar.
One clarification that matters, because this class of instrument is widely misdescribed: a soiling sensor measures PV-glass cleanliness — it does not measure energy loss. Energy loss also depends on irradiance, module behaviour, and system conditions. What the sensor gives you is a direct, repeatable reading of the variable you can actually act on. Our A60 PV Dust Measuring Instrument works on this principle: optical scattering, measurement range 100%–50%, accuracy 1% across 100%–90% and 4% across 80%–50%, stability 1% per year, response time under one second, RS485 Modbus with optional 4G, IP67, no moving parts, and no on-site calibration.
Whatever instrument you use, validate its readings against the site plan before you rely on them, and treat the number as a cleanliness indicator rather than a revenue figure.
5. Where manual cleaning stops being economic
Cleaning economics are size-dependent, and the crossover is sharper than most operators expect:
| Segment | Cleaning cost basis | Break-even soiling level |
|---|---|---|
| Residential, DIY | ~$60/yr | ~2% — usually worth doing |
| Residential, professional crew | ~$300/yr | ~8% — rarely worth it |
| Commercial, professional crew | $0.04–0.06/W/yr | 15–25% |
| Utility-scale, robotic | below truck-based O&M | standard practice in high-dust regions |
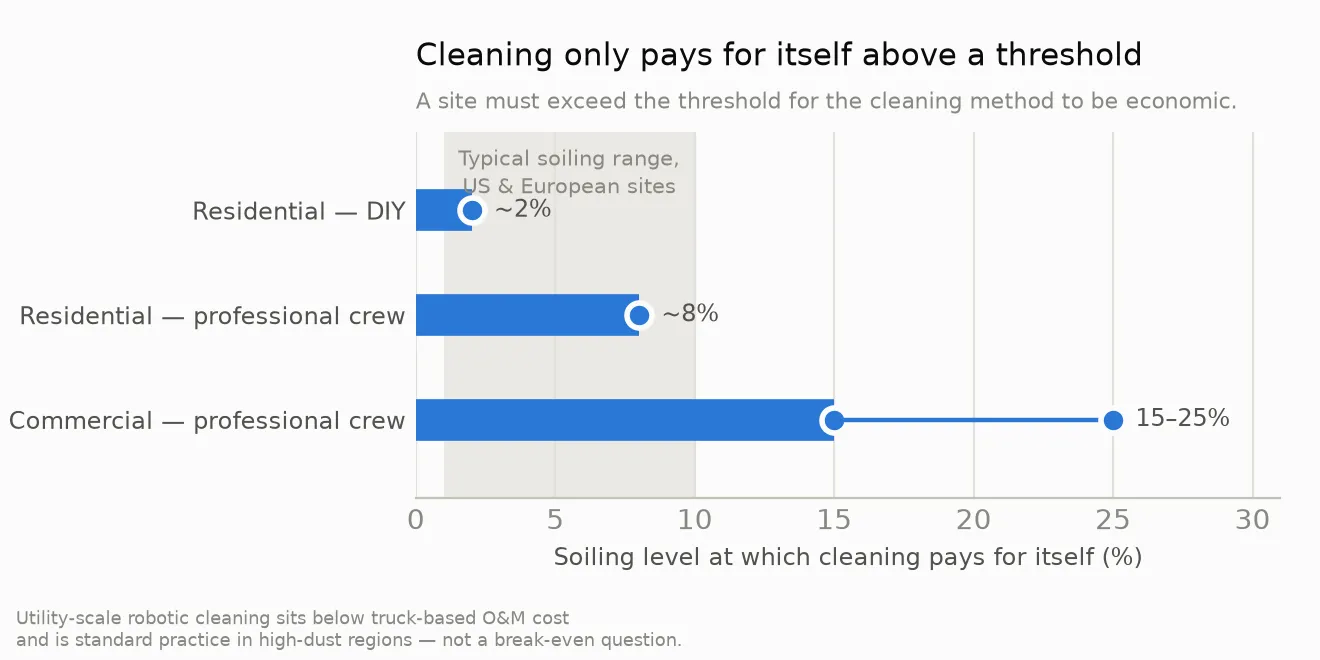
The pattern is clear. For residential systems in moderate climates, professional cleaning rarely pays for itself — labour cost per panel is too high relative to the energy recovered. As arrays grow larger and soiling gets heavier, the arithmetic flips hard:
- Utility-scale waterless cleaning robots vs. manual labour: payback in 1–3 years
- Residential and small-commercial robots: 8–15 years — usually not justified
The practical consequence: once your required frequency passes roughly quarterly, manual cleaning becomes both expensive and difficult to schedule, and the bottleneck shifts from whether to clean to how to clean that often with the crew you have. At that point the question is an equipment question. We cover the selection logic in our solution paths by site type, and the hardware in the R1 crawler robot and R2 crawler robot pages.
All figures above are USD and are drawn from published cleaning-economics datasets (see Sources). They are benchmarks for order-of-magnitude planning, not quotations. Labour rates, water cost, and access difficulty vary enough by region that any real cleaning decision should be costed against your own site.
6. How to validate a cleaning result
Most published “we cleaned the array and output rose by X%” claims are not measurable as stated, because they compare two different days. Two consecutive days can differ by 20–40% in yield on weather alone. Attribute that to cleaning and you have built a case on noise.
To produce a result that survives scrutiny, use one of the following, in descending order of strength:
- Same-day before/after. Read output in the morning, clean, read again in the afternoon at comparable irradiance. Irradiance conditions are largely controlled, so the comparison is defensible.
- Multi-day averaging. Average three to five days before cleaning and three to five days after. Weather noise is reduced, though not eliminated.
- Irradiance-normalised comparison. If you have GHI or a reference cell, normalise both periods and express the result as a performance ratio change. This is the most rigorous option and the one that supports a published claim.
- Soiling-sensor readings. An optical soiling sensor gives a direct before/after cleanliness figure, independent of weather. This does not by itself demonstrate an energy gain, but it removes all ambiguity about whether the array actually got cleaner.
Two further cautions:
- Check your chart axes. Monitoring dashboards auto-scale the Y-axis. A before/after pair of charts with different axis maxima will visually exaggerate or understate the difference. Fix the scale before publishing.
- State the conditions. A percentage gain is meaningless without irradiance, ambient temperature, and soiling level. Publish the conditions alongside the number.
We apply this methodology to our own project reporting, including the rooftop installation documented in our Romania project case.
Frequently asked questions
How often should solar panels be cleaned in the US?
It depends on region. The Pacific Northwest needs 0–1 cleanings per year. The Southwest desert needs quarterly to monthly. Texas, California’s Central Valley, and the industrial Midwest fall between those at 2–4 times per year.
Can I just rely on rain to clean my solar panels?
No. Rain removes roughly 40–75% of loose dust and almost none of the pollen, bird droppings, soot, or cemented dust that cause the larger losses. In low-rainfall or high-dust regions, rain is not a substitute for cleaning.
Do solar panels really lose that much power from dirt?
It depends on how the loss is measured. Time-based losses range from 1–3% annually in humid climates to 10–25% in desert regions. Density-based losses range from 2–3% at 0.1 mg/cm² to 30–45% above 5 mg/cm². Post-dust-storm losses can reach 40–60%. Heavily soiled modules also run 7–12 °C hotter, adding 3–5% further loss.
How do I know when my panels actually need cleaning?
An in-line soiling sensor is the only method that scales, because it measures glass cleanliness continuously and can trigger cleaning on condition. Visual inspection misses anything below roughly 5% loss, and comparing output across different days is unreliable unless irradiance is normalised.
Is professional cleaning worth it for a home system?
Usually not in moderate climates. Residential professional cleaning costs roughly $300 per year against a break-even soiling level of about 8%, which most residential sites in the US and Europe never reach. DIY cleaning at around $60 per year breaks even at about 2%, which is why it is usually the better option at residential scale.
Does a soiling sensor tell me how much energy I am losing?
No. A soiling sensor measures PV-glass cleanliness, or soiling ratio. Energy loss also depends on irradiance, module behaviour, and system conditions. The sensor tells you how dirty the glass is — which is the variable you can act on — not what the dirt is costing you in revenue.
Should I clean my panels in winter?
Lower sun angles and snow cover change the calculation, and cleaning in freezing conditions introduces its own risks. In most of Europe and the northern US, winter is a low-yield period; the highest-value cleaning windows are late spring and late summer, after pollen and after peak dust season. Snow should be removed by other means — never by scraping.
Sources
- Energy Solutions — Solar Panel Cleaning & Soiling Loss Data 2026: ROI Analysis (regional soiling rates, cost benchmarks, payback periods)
- ScienceDirect — Impact of dust accumulation on PV and CSP systems: experimental analysis and simulation insights in semi-arid climate
- Green Building Africa — Cemented soiling of solar panels in hyper-arid regions can cause annual energy losses of up to 9.8%
- Solaris Hydrobotics — Water Quality for Solar Panel Cleaning (TDS thresholds; used in the companion article on cleaning water)