PV cleaning equipment manufacturer
PV cleaning equipment manufacturer

How Much Does Solar Panel Cleaning Cost? 2026 Prices per Panel, per kWp and per Visit
Published 2026 solar panel cleaning prices: 5−20 perpanelathome,about 4-6 per kWp on commercial roofs, under $5 on farms. Sources and math included.

The short answer
Published 2026 price guides put a professional clean of a home system at about $100–350 per visit, or $5–20 per panel; Thumbtack’s platform data give a typical $209 in the US and MyJobQuote £100–150 in the UK. Converted to one scale, that is about $19–34 per kWp per visit for a home, $3.75–6.25 on a commercial roof and $0.33–4.73 on a solar farm. The per-kWp price falls by roughly an order of magnitude between a home and a solar farm. Our reading is that this is largely because a visit has fixed costs that do not scale with the number of panels.
The price is the easy half. Whether a visit is worth buying depends on the energy it wins back. At home-system prices one visit has to recover 7.5–13.4% of a year’s output to pay for itself; modelled average soiling loss in Europe is 0.9–5.3%. On energy alone, a professional visit rarely pays at home. On a commercial roof the break-even is 1.8–3.1%, and it pays where soiling is heavy. Section 5 shows the arithmetic so that you can replace our inputs with yours.
Scope and disclosure. This article covers what cleaning costs. How often to clean is in How Often Should You Clean Solar Panels?, method choice in Dry vs Wet Solar Panel Cleaning, water quality in Can You Clean Solar Panels With Tap Water?, and whether a robot pays in Are Solar Panel Cleaning Robots Worth It?. WaterSprayElephant makes PV cleaning equipment, so every price below is a figure published by a third party, with its publisher and date, and the conversions are shown. This article contains no WaterSprayElephant prices. None of the prices is a quote, and most are not audited.
1. What is actually published
Cleaning is priced per visit for homes, per panel for larger jobs, per m² of module area in Germany, and as a line inside an O&M budget for plants. Table 1 lists what we found, who published it and what the number rests on. Two sources (Thumbtack and MyJobQuote) say their figures come from quotes given to customers on their platforms. The rest do not describe a sample or a method.
| Segment | Published price | Publisher and date | What it rests on |
|---|---|---|---|
| US homes, platform data | $209 typical per visit; range $142–310 | Thumbtack, updated 31 March 2026 | Attributed to Thumbtack data: estimates that local professionals give customers on the platform. No sample size or method published. |
| US homes, price guides | $100–350 per visit by system size; $5–20 per panel | Solar Energy Simplified (28 March 2026), Clean My Solar Panels (30 March 2026), Helios Energy Global (1 September 2026), Solar Powered Project (updated 4 October 2026) | None states a sample or method. Publishers include an affiliate-funded editorial site, a directory that connects homeowners with local cleaning professionals, and a Southern California solar installer. |
| UK homes | £100–150 per visit for most homes; £4–15 per panel, sometimes with a minimum charge | MyJobQuote, 12 October 2026 | Described as quotes given by UK tradespeople to homeowners on its platform. How ranges were calculated is not shown. |
| Spain, homes | €5–10 per panel, plus a minimum charge for travel (amount not given) | OCU (consumer organisation), 21 February 2024 | No method stated. |
| Germany, homes | €2–2.50 per m² (example: €100–125 for 50 m²) | photovoltaik.org, updated 30 May 2024 | No source named. |
| US commercial and utility | Per panel: $2.50 for non-residential rooftops under 1 MW; $1.50 for rooftops over 1 MW and for carports; $0.37–1.75 for utility plants, falling with size. All plus mobilisation and demobilisation fees (amounts not given). | Soilar Technologies price list, undated | Stated conditions: filtered water on site, standard panels, site in good condition. No source for the prices. |
| Europe, plants (literature) | €0.3–4.3 per kW per cleaning, seven countries | Ilse et al. 2019, as reported in Fernández Solas et al. 2025 | Peer-reviewed; cost data from 2019, available for only seven countries. |
| Modelling example | €0.2 per m² per cleaning | IEA PVPS Task 13, 2022 | An input to the report’s worked example, not a survey. |
| Plant O&M model | $24,995 per year on the “Cleaner” labour line of a 10 MW ground-mounted plant | NREL/TP-5C00-74840, 2020 | Model output. The report text does not give the cleaning frequency behind it. |
A note on the last row: the figure’s caption in the NREL report says 1 MW, but its text, its table label and its $14.14 per kW per year total all correspond to 10 MW, so we use 10 MW. Dividing by 10,000 kW gives $2.50 per kW per year. The division is ours, and it is a model result, not an observed price.
2. Putting the prices on one scale: dollars per kWp per visit
Per-visit, per-panel and per-m² prices cannot be compared directly, so we convert each to US dollars per kWp of array capacity per visit. Three conversions are ours: 400 W per panel for per-panel prices (modules of 550 W would lower every per-panel conversion by about 27%), €1 = $1.10 and £1 = $1.30. For per-m² prices we use 21.4% module efficiency (0.214 kWp per m²), the value used in the European study. For the US size-band tables from Solar Energy Simplified and Helios, we divide each band’s midpoint price by its midpoint capacity, which needs no panel-wattage assumption.
| Segment and source | Published unit | US dollars per kWp per visit | Note |
|---|---|---|---|
| US homes, two size-band tables | $ per visit by system size | $19–34 (band midpoints); $13–58 across all band edges | Per-kW price falls as systems grow: from about $34 per kW in the 3–5 kW band to $25 in 13–16 kW (Solar Energy Simplified), and from $26 to $19 across Helios’ 4–15 kW bands. |
| US homes, four guides | $5–20 per panel | $13–50 | At 400 W per panel. |
| UK homes, MyJobQuote | £4–15 per panel | $13–49 | Minimum charges raise the cost of small jobs. |
| Spain, OCU | €5–10 per panel | $14–28 | Excludes the travel minimum. |
| Germany, photovoltaik.org | €2–2.50 per m² | $10–13 | Priced on module area, not panel count. |
| US commercial rooftops, Soilar | $1.50–2.50 per panel | $3.75–6.25 | At 400 W per panel; mobilisation extra. |
| US utility plants, Soilar | $0.37–1.75 per panel | $0.92–4.38 | At 400 W per panel; mobilisation extra. |
| Europe, seven countries (Ilse 2019) | €0.3–4.3 per kW | $0.33–4.73 | 2019 cost data. |
| IEA PVPS Task 13 example | €0.2 per m² | $1.03 | At 0.214 kWp per m². |
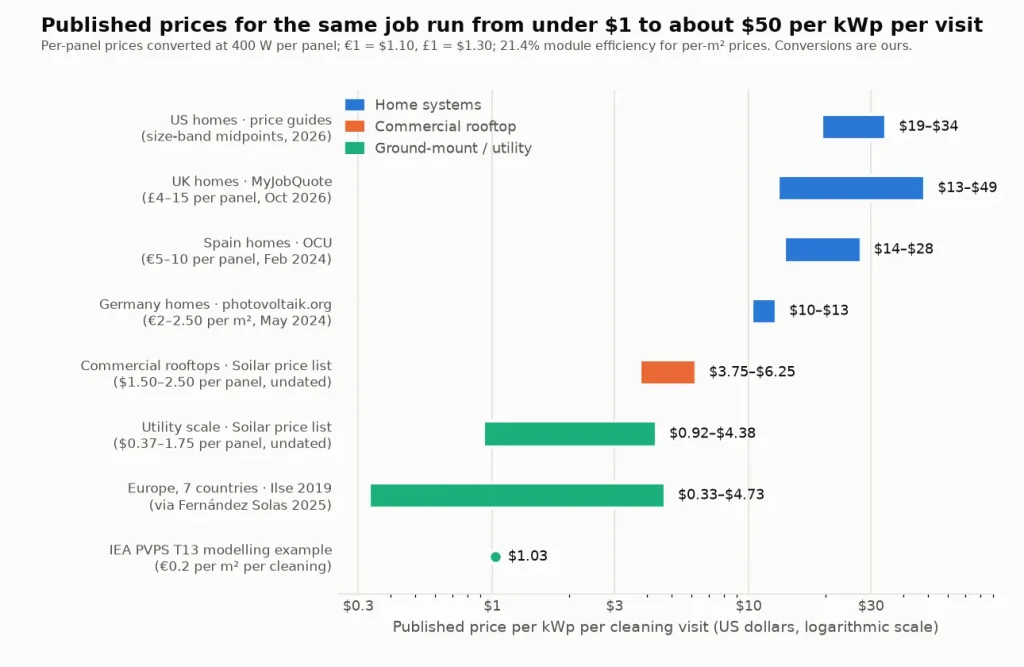
Read across the table, home systems cost about $10–58 per kWp per visit in the guides and platform data we found, the one commercial-roof price list implies about $3.75–6.25, and the plant figures run from $0.33 to $4.73. The utility list and the European literature overlap, which is some support for the farm end of the range. The commercial-roof row rests on a single undated price list, so treat it as the least certain row.
3. Why the price per kWp falls as the job grows
The sources do not decompose their prices, but they name the same drivers repeatedly:
- A fixed cost per visit. OCU notes that companies usually charge a minimum for travel, MyJobQuote says per-panel prices sometimes come with a minimum charge, and Solar Powered Project lists a minimum call of $150–300 or more. A visit costs something before the first panel is wet, and a small job spreads it over few panels.
- Access. Helios adds $25–75 or more per visit for difficult roof access; Clean My Solar Panels prices multi-storey or steep-pitch homes at $250–400 or more against $110–260 for a standard single-storey home; MyJobQuote’s calculator separates ground, single-storey, two-storey and three-storey or steep roofs.
- Volume. Thumbtack quotes one company at $129–149 for up to 32 panels and $2.50 for each panel after that. Soilar’s utility prices fall from up to $1.75 per panel at 10 MW to as low as $0.37 at 101–250 MW.
- Contracts. Solar Energy Simplified and Helios both say that repeat visits or annual contracts cut the per-visit price by 10–20%. Solar Energy Simplified’s average two-visit annual contract is $375, against $225 for a single visit, about 17% below two single visits.
- What is included. Soilar’s list assumes filtered water on site and charges mobilisation separately; Helios excludes add-ons such as bird-proofing and inspection reports. Two quotes for “a clean” can differ in scope.
None of the sources ties its price to how soiled the array is, so treat the ranges as prices for a routine wash, not for restoring a heavily soiled array.
4. From price per visit to cost per year
Annual cost is the price per visit times the number of visits. How many visits a site needs is the subject of the frequency guide; the price guides above assume one or two visits a year for homes. Table 3 multiplies the per-kWp prices from Table 2 by one, two and four visits.
| Segment | 1 visit per year | 2 visits per year | 4 visits per year |
|---|---|---|---|
| Home system, US prices | $19–34 | $38–69 | $77–138 |
| Commercial rooftop | $3.75–6.25 | $7.50–13 | $15–25 |
| Ground-mount, IEA PVPS example price | $1.03 | $2.06 | $4.11 |
As a cross-check on the farm end: two visits at the IEA example price come to $2.06 per kWp per year, and NREL’s model carries $2.50 per kW per year on its cleaner line. The two are the same order of magnitude. That is consistent, not a validation, because the NREL report does not state the cleaning frequency behind its figure.
5. Is a visit worth its price? The break-even recovery
A cleaning pays for itself in energy only if it wins back enough output. The break-even share is the price per kWp divided by the value of a year’s output per kWp, which is the specific yield times the electricity price. We use a specific yield of 1,400 kWh per kWp per year (the NREL O&M model example; adjust to your site) and these electricity prices: $0.1831 per kWh for US residential and $0.1453 for US commercial (EIA, July 2026, preliminary), and $0.035 for ground-mount plants (the average newly signed PPA price in LBNL’s Utility-Scale Solar, 2024 Edition).
| Segment | Price per visit ($ per kWp) | Value of 1% of annual output ($ per kWp per year) | Break-even recovery per visit |
|---|---|---|---|
| Home system (US prices) | $19–34 | $2.56 | 7.5–13.4% |
| Commercial rooftop | $3.75–6.25 | $2.03 | 1.8–3.1% |
| Ground-mount / utility | $0.92–4.38 | $0.49 | 1.9–8.9% (2.1% at the IEA example price) |
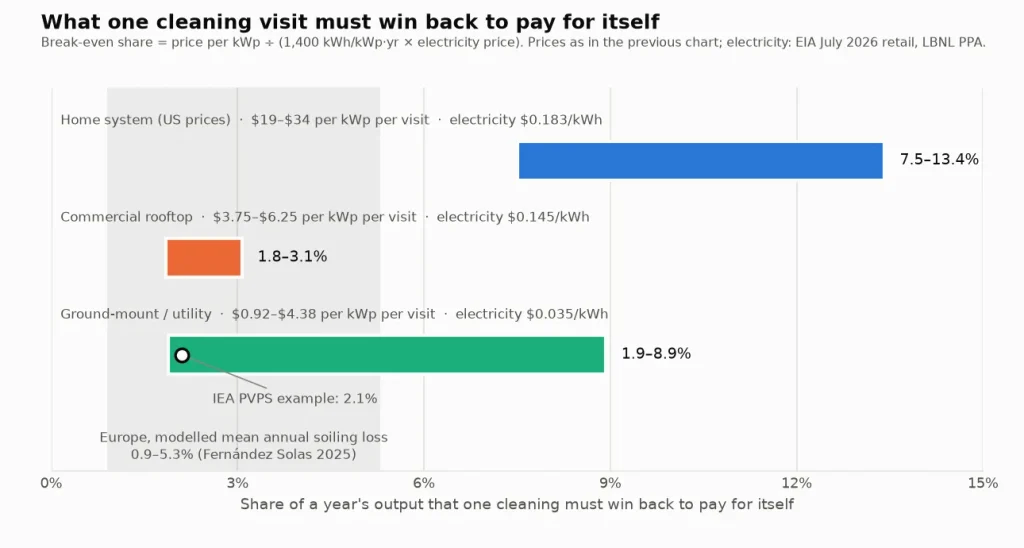
The shaded band in the chart is the modelled average loss with no manual cleaning, which is the most a cleaning programme could win back on average. A cleaning cannot recover more than the soiling that exists, and one visit cannot remove a whole year’s average loss. At home-system prices the break-even share (7.5–13.4%) is above the whole European band, so at those averages a professional visit does not pay back in energy. A commercial rooftop (1.8–3.1%) sits inside the band: a visit can pay where soiling is in the upper part of the range. Ground-mount depends on which price list you believe: 2.1% at the IEA example price, up to 8.9% at the top of the Soilar utility list.
Four limits apply. First, we mix US prices with European soiling averages because the annual soiling averages we could verify are European; a US site with heavy dust can sit well above the band, so measure yours. Second, the break-even share scales inversely with the electricity price, so at a price twice as high, halve it. Third, soiling is seasonal, and the European study notes that locations with high seasonality benefit more from cleaning because losses peak, so timing a visit before the dry season recovers more than the annual average implies. Fourth, reasons other than energy for paying for a visit, such as an inspection done on the roof, are outside this arithmetic.
6. If you run a cleaning business: building a quote
Price guides are not a cost model. To decide what to charge, build the price up from your own costs, then compare it with Table 1 as a sanity check.
| Line | How to get it | What published data we could verify |
|---|---|---|
| Crew labour | Hourly rate × crew size × (drive time + time on site) | US median hourly wages, May 2025 (BLS): $17.71 for janitors and building cleaners, $25.55 for solar PV installers. Wage only, excluding payroll costs. Job time: one company quoted by Thumbtack takes about 1.5–2 hours for up to 32 panels (crew size not stated); MyJobQuote says most homes take 30–45 minutes and larger properties up to 90. |
| Vehicle and travel | Kilometres per job × your cost per kilometre | None verified. |
| Water | Litres per panel × your water price, plus treatment where you need low-TDS water (see our water-quality article and the A40 mobile RO system) | We found no published price for cleaning water. Use your own bill. |
| Equipment and consumables | Purchase price ÷ expected jobs per year; brushes, poles and pumps wear out | None verified. Use supplier quotes. |
| Insurance, permits, paperwork | Annual cost ÷ jobs per year | None verified. |
| Margin | Your target | None. |
The labour line is smaller than many people expect. At 16–21 panels per hour and the two wage figures above, labour at wage level comes to $0.83–1.60 per panel per worker. Against Solar Energy Simplified’s average of $8 per panel, one worker is 10–20% of the price and two workers 21–40%. This is a floor built from one company’s stated job time, not a measured crew cost. Our reading is that fixed costs per visit (travel, set-up, insurance, paperwork) and margin account for much of the remainder, but no source itemises them.
A practical check on any per-panel rate: compute your fixed cost per visit F (travel, set-up, paperwork) and your variable cost per panel v (labour, water, consumables). Your break-even price for an N-panel job is F / N + v per panel. At N = 10 the fixed term is spread over ten panels, and at N = 1,000 over a thousand. So one flat per-panel price tends to overcharge large jobs or lose money on small ones.
7. In-house crew or contractor: an equipment budget ceiling
The same published prices let you work backwards. If a contractor charges S per year for your plant and you would run your own crew, the equipment you can justify over 10 years at a 5% discount rate is at most 8.11 × (S − R), where R is your own annual running cost for labour, water, vehicle and maintenance. The factor 8.11 is the 10-year, 5% annuity factor used in the robot payback article. Table 6 sets R to zero, so it is an upper bound.
| Plant | Price used ($ per kWp per visit) | Contractor spend, 2 visits per year | Equipment ceiling, 2 visits | Contractor spend, 4 visits per year | Equipment ceiling, 4 visits |
|---|---|---|---|---|---|
| Commercial rooftop, 250 kWp | $6.25 | $3,100 | $25,000 | $6,300 | $51,000 |
| Commercial rooftop, 2 MWp | $3.75 | $15,000 | $120,000 | $30,000 | $240,000 |
| Ground-mount, 2 MWp | $1.03 | $4,100 | $33,000 | $8,200 | $67,000 |
| Ground-mount, 50 MWp | $1.03 | $100,000 | $830,000 | $210,000 | $1,700,000 |
How to read Table 6. Every $1 of annual running cost you carry in-house lowers the ceiling by $8.11, and once your running cost reaches the contractor’s annual price there is no equipment budget at which in-house is cheaper. The commercial-rooftop prices are the Soilar list values and the ground-mount price is the IEA example; the visit counts are illustrations, not recommendations. For a plant of a few hundred kWp the contractor’s annual price is a few thousand dollars, and a crew’s time, travel and water have to fit inside it.
If you do cost out a crew, our hand-held and pole-mounted range is specified by project area: about 100–500 m² for the G1 and G2, and about 500–6,000 m² for the G3 and G4 (manufacturer-published figures). We have not put prices on them here. For robots, the same logic with the energy recovered added is worked through in the robot payback article.
8. Getting a quote you can compare
- Ask for the price and what it covers. Number of panels or kWp, number of visits, and whether the price is per visit or per year. Convert to dollars per kWp per visit so you can compare it with Table 2.
- Ask what is included. Water source and treatment, access equipment, mobilisation, inspection, before-and-after photos.
- Get access surcharges up front. Roof pitch and number of storeys move the price by tens of dollars or more per visit in the guides above.
- Ask about visit count and contracts. Two of the guides report 10–20% off for repeat visits or annual plans.
- Compare the price with your break-even share from Table 4 and with your own measured soiling loss.
- Collect at least two or three local quotes. The published ranges are wide, and only platform data reflect actual quotes.
Frequently asked questions
How much does it cost to clean solar panels?
For a home system, published 2026 guides put a professional visit at about $100–350. Thumbtack’s platform data give a typical $209 in the US, with a range of $142–310, and MyJobQuote gives £100–150 for most UK homes. Prices rise with roof height and pitch and fall with system size.
How much does solar panel cleaning cost per panel?
Four US guides give $5–20 per panel, MyJobQuote gives £4–15 in the UK and OCU gives €5–10 in Spain. Minimum call-out charges often apply to small jobs, so a few panels can cost more per panel than a large array.
How much does solar panel cleaning cost per kW or per watt?
At the US home prices in the size-band tables, about $19–34 per kWp per visit, which is 0.019–0.034 dollars per watt. One commercial-rooftop price list implies $3.75–6.25 per kWp, and utility-plant figures run from $0.33 to $4.73 per kWp per visit. Per-panel conversions assume 400 W per panel.
How much does commercial solar panel cleaning cost?
We found one commercial price list, Soilar Technologies’ undated list: $2.50 per panel for non-residential rooftops under 1 MW and $1.50 for rooftops over 1 MW, plus mobilisation fees. We found no platform quote data for commercial work, so request a site quote.
How much does utility-scale panel cleaning cost per year?
NREL’s model example carries $24,995 per year on the cleaner line for a 10 MW plant, or $2.50 per kW per year by our division. Literature cost per cleaning runs $0.33–4.73 per kWp across seven European countries (2019 data). Annual cost is the per-visit price times the number of visits.
Is it cheaper to clean solar panels yourself?
Solar Energy Simplified gives $0–30 per cleaning for DIY (its own breakdown is $2–14) plus $50–250 for equipment, and Solar Powered Project lists a DIY kit at $30–60. Neither states a basis for these figures. The cash cost is lower than a visit; the guides do not price your time or roof access, and neither do we.
Does an annual cleaning contract cost less?
Solar Energy Simplified and Helios both report 10–20% off per visit for repeat visits or contracts. Solar Energy Simplified’s average two-visit contract is $375 against a $225 single-visit average, about 17% below buying two visits separately.
How much should I charge to clean solar panels?
The published prices are not a basis for that decision, because most do not disclose how they were gathered. Build the price from your own labour, travel, water, equipment, insurance and margin as in Section 6, then compare it with Table 1.
Is professional cleaning worth it for a home solar system?
On energy alone, usually not at the European average soiling. At US home prices one visit has to win back 7.5–13.4% of a year’s output, and the modelled average annual soiling loss in Europe is 0.9–5.3%. Heavily soiled sites are the exception, so measure your own loss before paying for regular visits.
Sources
- Thumbtack — How much does it cost to clean solar panels? (updated 31 March 2026) (US national range and typical cost; one company’s per-panel and 32-panel flat-rate example, job time)
- MyJobQuote — Solar Panel Cleaning Cost Guide, UK prices (12 October 2026) (UK per-visit and per-panel prices, job time, access effect)
- Solar Energy Simplified — Solar Panel Cleaning Cost in 2026 (28 March 2026) (US per-visit prices by system size, per-panel prices, contracts, DIY costs)
- Clean My Solar Panels — Solar Panel Cleaning Cost Guide (30 March 2026) (US per-visit and per-panel prices, single- vs multi-storey)
- Helios Energy Global — Solar Panel Cleaning Cost 2026 (updated 1 September 2026) (Southern California per-visit prices by system size, access surcharge, repeat-visit discount)
- Solar Powered Project — Solar Panel Cleaning Cost: DIY vs Professional (updated 4 October 2026) (per-panel and minimum-call prices, DIY kit cost)
- OCU — Cómo limpiar paneles solares (21 February 2024) (Spanish per-panel price, minimum travel charge)
- photovoltaik.org — Photovoltaik reinigen (updated 30 May 2024) (German per-m² price)
- Soilar Technologies — Solar Panel Cleaning Pricing (undated) (US commercial and utility per-panel price list and its stated conditions)
- NREL — Model of Operation-and-Maintenance Costs for Photovoltaic Systems (NREL/TP-5C00-74840, 2020) (cleaner labour line in the 10 MW worked example, specific-yield example)
- Fernández Solas et al. — Photovoltaic soiling loss in Europe: Geographical distribution and cleaning recommendations, Renewable Energy 239 (2025) (European cleaning costs from Ilse et al., 21.4% module efficiency, annual soiling loss with and without rain cleaning, seasonality)
- Ilse et al. — Techno-Economic Assessment of Soiling Losses and Mitigation Strategies for Solar Power Generation, Joule 3 (2019) (10-year / 5% method behind the annuity factor)
- IEA PVPS Task 13 — Soiling Losses: Impact on the Performance of Photovoltaic Power Plants (T13-21:2022) (cost-per-cleaning example of €0.2 per m²)
- US EIA — Electric Power Monthly, Table 5.6.A (residential and commercial average retail prices, July 2026, preliminary)
- Berkeley Lab — Utility-Scale Solar, 2024 Edition (average levelized PPA price)
- US BLS — Occupational Outlook Handbook: Janitors and Building Cleaners (median hourly wage, May 2025)
- US BLS — Occupational Outlook Handbook: Solar Photovoltaic Installers (median hourly wage, May 2025)