PV cleaning equipment manufacturer
PV cleaning equipment manufacturer

How to Measure Solar Panel Soiling Loss Without a Reference Cell: Four Methods Compared
How to measure solar panel soiling loss without a reference cell: yield analysis, cleaning tests, optical sensors and imaging, with published uncertainty.

The short answer
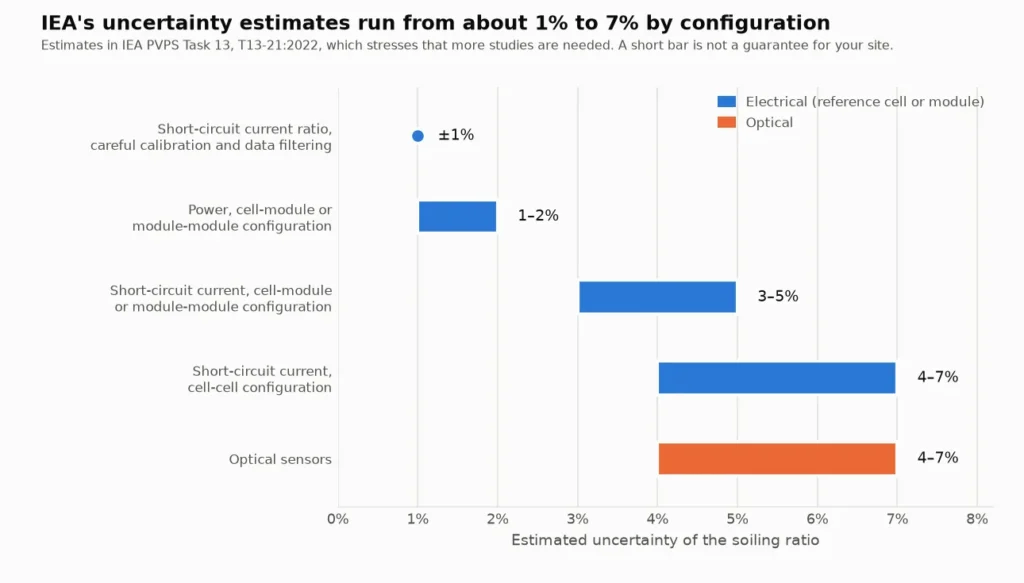
You can estimate soiling loss without a reference cell in four ways: extract it from the plant’s own yield data, run a controlled before-and-after cleaning test, install an optical soiling sensor, or analyse images. They answer different questions. Yield extraction and cleaning tests measure the effect on electrical output, but one is retrospective and the other covers a single moment. Optical sensors give a continuous reading, but of the dirt on their own piece of glass, converted to an equivalent loss by calibration. IEA PVPS Task 13 estimates the uncertainty of optical methods at 4–7%, against 1–2% for power measured on a cell-module or module-module reference, and stresses that these are estimates. Our reading of the evidence is that a continuous indicator plus a periodic power-based check is easier to defend than any single method.
Sections 1 and 2 define the terms and the reference-cell baseline, Section 3 compares the four methods, Sections 4 to 7 take them one at a time, Section 8 covers placement and validation, Section 9 explains why non-uniform soiling defeats the simple methods, and Section 10 turns a reading into a cleaning decision with a worked example.
Scope and disclosure. This article covers how to measure soiling loss when you have no reference cell, or cannot depend on one. It does not rank products. We make an optical PV dust sensor, the A60 PV Dust Measuring Instrument. Section 6 sets its published specifications beside the evidence on optical sensors in general, including the points that count against relying on a single optical sensor. How Often Should You Clean Solar Panels? gives a short overview of checking whether an array needs cleaning; this article is the detailed version. Cleaning cost is in How Much Does Solar Panel Cleaning Cost?, robot payback in Are Solar Panel Cleaning Robots Worth It?, and what rain does and does not remove in Does Rain Clean Solar Panels?
1. What soiling loss is, and the two numbers you need
Soiling is described by two metrics that answer different questions. The soiling ratio is the current state. IEC 61724 defines it as the ratio of the power of a PV array in soiling conditions to the power of the same array in clean conditions (as set out in IEA PVPS Task 13, T13-21:2022). It is 1 with no soiling and falls as dirt accumulates. The soiling loss is one minus the soiling ratio, which the standard also calls the soiling level, so a soiling ratio of 0.95 is a 5% loss. The literature uses Cleanness Index, Soiling Factor and Soiling Loss Factor for the same idea.
The soiling rate is the daily change in the soiling ratio while dirt accumulates, in %/day and conventionally negative. Combined with the pattern of rain and cleanings, it predicts near-future losses. IEA reports that Deceglie et al. and Besson et al. calculate rates only over periods of at least 14 days without a cleaning event, so that a trend is not fitted through too few points, and that the Theil-Sen estimator and bisquare-weighted least squares are used in place of ordinary least squares, which outliers and unaccounted cleanings can bias.
Three conventions change the number you read:
- Time of day. The electrical effect of soiling varies through the day with the angle of incidence and the mix of direct and diffuse light. IEC 61724 recommends measuring within 2 hours of solar noon for fixed devices, or at an angle of incidence below about 35° for trackers. Some authors use 24-hour data because it is a more direct measure of the effect on energy yield.
- Weighting. Annual figures are sometimes irradiance-weighted, so that soiling during the most intense hours counts for more.
- Current or power. Most sensors approximate the soiling ratio from short-circuit current (Isc) instead of power. With uniform soiling, temperature-corrected Isc is proportional to power. With non-uniform soiling it is not, and Section 9 shows why that matters.
These are ratios of electrical output. They are not a dust-density figure in mg/cm², and we have not found a conversion from density to loss that holds across particle sizes, compositions and light angles. A reading in either unit answers a different question.
2. Why the reference cell is the default, and what it costs
A reference setup compares two devices side by side. One is cleaned regularly, the other is left to soil, and the ratio of their outputs is the soiling ratio. IEA lists three configurations: cell-cell, module-module and cell-module. The comparison is direct and needs no model of the plant, which is why it became the default. The costs are documented in five places:
- Someone has to clean the reference. IEA says the reference device is preferably cleaned every morning, because most deposition occurs at night, but that in real cases it is often cleaned weekly unless cleaning is fully automatic, and that an inadequate cleaning frequency can produce a significant underestimation of the soiling ratio.
- Cleanings can be missed or imperfect. Bessa et al. (2021) note that even automatic stations can leave the edges and corners of the reference device soiled, and that incorrect or undone cleanings can add significant measurement uncertainty.
- The reference may not soil like the array. A textured cover glass soiled up to 7% more than regular glass in one study cited by IEA, and some anti-reflection coatings may reduce soiling by as much as 60% depending on location.
- A soiled reference cell cannot show non-uniform soiling. A module-module setup can, at a higher maintenance cost. A cell-module setup keeps the cell easy to clean automatically while the module represents the array (IEA).
- Readings lag and drop out. In a 2024 study of 16 Spanish plants (727 MWp), the reference panel of each two-panel kit was cleaned manually, usually weekly. The authors describe the sensor data as not accurate: the sensors need a certain level of irradiance, do not work well under cloud or very high particle concentrations, and missed a dust event in March 2023. They say an increase in soiling is not recorded until the reference has been cleaned, so they compared 7-day averages and assumed a 2-day delay (Redondo et al.). The paper also reports an average difference of 0.98% between two sensors at the same location, a figure taken from the authors’ earlier validation at five plants.
None of this is an argument against reference devices. IEA gives its most accurate figures, 1–2%, for power measured in a cell-module or module-module configuration. The point is narrower: if you have no reference device, cannot keep one cleaned, or cannot get one that represents your array, there are other routes, and each has its own failure modes.
3. Four ways to measure soiling without a reference cell
Table 1 compares them on what they actually measure. The last three columns decide most choices: whether the method sees non-uniform soiling, what validation exists, and where it fails.
| Method | What it measures | Extra hardware and labour | Sees non-uniform soiling? | Published validation | Main weakness |
|---|---|---|---|---|---|
| A. Yield-based extraction (SRR, performance-ratio trend) | Soiling ratio inferred from the plant’s own energy relative to a model | Monitoring data and irradiance; no site visits | Only inside total output; it cannot say which modules | 11 US soiling stations: RMSE 0.9 percentage points on a soiled device’s pseudo-yield (Deceglie et al., 2018) | Needs a good performance model, outage and clipping filters and weeks of data; retrospective |
| B. Before-and-after cleaning test | Power or IV curve of the same modules, dirty and then clean | IV tracer or string-level data, and a cleaning crew | Yes, if power is measured | Burgdorf, 30 kWp: gains of 2.3–10% over seven cleanings (IEA) | One moment only; irradiance and temperature move between the two measurements |
| C. Optical soiling sensor | Light scattered or transmitted by the sensor’s own glass, converted to an equivalent loss | A sensor and a data logger; little or no cleaning | No: it reads one small piece of glass | IEA estimate 4–7%; Logan, Utah: up to 2% error in monthly soiling rate against 1% for soiling stations (as summarised by Bessa et al.) | Representativeness, spectral and angle assumptions, dependence on dust type |
| D. Imaging (microscope, camera, drone) | Share of the glass area covered by dirt, converted to a loss | A camera or microscope; aerial surveys need a flight | Aerial imaging can; a microscope on a glass coupon cannot | India field study: within 1% of a commercial soiling station after calibration (as summarised by Bessa et al.) | Aerial methods are expensive or impractical for constant monitoring |
The categories overlap in the literature. IEA counts the Mars camera-based sensor among the optical sensors, and Bessa et al. treat microscope-based coupons as an optical measurement with image processing. We separate them by what a user would install.
4. Method A: extract soiling from your own yield data
The idea is to use the plant as its own sensor. Divide measured daily yield by what a model says a clean plant would produce to get a performance index. Soiling shows up as a slow downward trend that jumps back up after rain or cleaning. Deceglie, Micheli and Muller (2018) built the Stochastic Rate and Recovery (SRR) method on this, and it is available in the open-source RdTools library. The steps are:
- Compute the daily performance index (measured yield divided by modelled yield), after filtering clipping and outages. RdTools documents the input as a daily performance metric, such as a performance index or yield, or alternatively a soiling ratio from a sensor, with data that should be insolation-weighted daily aggregates.
- Detect cleaning events as positive shifts in a centred 14-day moving median that exceed Q3 + 1.5 × IQR.
- Fit the soiling rate within each interval between events with the Theil-Sen estimator, taking the size of each cleaning as a lower bound.
- Run a Monte Carlo simulation (1,000 repetitions) to give a median and a 95% confidence interval for the insolation-weighted soiling ratio.
The method needs no precipitation data and no parameter tuning. The authors validated it on 11 US soiling stations with records of 226 to 1,063 days, treating the station values as the truth. Against those, SRR had an RMSE of 0.009, which is 0.9 percentage points of soiling ratio by our conversion, and the best coefficient of determination. The common fixed-rate-and-precipitation-threshold (FRP) methods gave RMSE from 0.009 to 0.044, depending on the cleaning threshold and refractory period chosen.
Four limits belong with that result. The validation used the pseudo-yield of the soiled device in a soiling station, not data from a full PV system. The station values carry their own uncertainty and a co-soiling bias, since the control devices were cleaned only every 2–14 days. Ground irradiance sensors soil too, which is why the paper prefers satellite irradiance, although at one of the 11 sites satellite data were too noisy and ground measurements were used. And cleaning detection works better with less noise and fewer artefacts in the data. Bessa et al. add that extraction methods need non-soiling problems removed first and are biased by how irradiance and temperature data are sourced.
The simplest version is a temperature-corrected performance ratio. IEA says it can give a good estimate of soiling rates and loss in dry seasons as long as the plane-of-array irradiance sensor is cleaned and maintained, and that the sensor’s absolute uncertainty matters little if its short-term stability is adequate. Our reading is that, because yield extraction works on the intervals between cleaning events and needs enough days in each, it suits a monthly or seasonal review, and the calibration of a faster indicator, better than a live trigger.
5. Method B: a controlled before-and-after cleaning test
This is the one method in the list that measures the electrical effect directly, with no model and no reference device. We did not find it written up as a standard procedure, so the design below is ours, built from the cautions in the IEA report and IEC 61724. Adapt it to your instruments:
- Choose the test group. A string, or a few modules, in more than one place on the site (Section 8). Include modules where dirt collects, such as the lower edge.
- Pick the window. A clear-sky period within 2 hours of solar noon, with steady irradiance.
- Clean the irradiance sensor first. Bessa et al. note that IV measurements are exposed to large errors if the irradiance sensors are not clean.
- Measure before. Power or the full IV curve of the group, with plane-of-array irradiance and module temperature.
- Clean the group completely and measure again within minutes, in the same conditions.
- Correct and compare. Bring both readings to the same irradiance and temperature (IEA refers to the IEC 60891 methods). The ratio of before to after is the soiling ratio of that group at that moment.
- Log the history. Note the days since the last rain or cleaning. Divide the loss by that number of days for an average rate, which is only meaningful if rain did not partly clean the modules in between.
The published examples show how wide the gains are. At Burgdorf, Switzerland, the IEA report lists string IV measurements some days before and after each of seven cleanings of a 30 kWp array, with gains from 2.3% to 10.0%. At five North Carolina plants, manual cleaning recovered 5–11% in an analysis of operating data, as described in our rain article; that was not a controlled test.
Three pitfalls apply. First, whatever the cleaning leaves behind counts as clean, so a cemented film that a brush does not remove will be read as no loss. Second, irradiance can change between the two readings, so use the same instruments and keep the gap short. Third, the result is one point. It tells you the state of that group on that day, not the rate, and a single test cannot tell whether the group is typical of the array.
6. Method C: optical soiling sensors
Optical soiling sensors estimate the soiling ratio from the optical properties of the dirt on a piece of PV glass. Bessa et al. describe them as typically designed to need no water or cleaning, little or no maintenance and no moving parts. In IEA’s description, the Kipp & Zonen DustIQ uses a pulsed blue LED to measure scattered light and converts the transmission loss into an equivalent loss in short-circuit current and power; the Atonometrics Mars sensor uses a camera behind a diffuser and image processing.
What the evidence says about them is mixed, and the mix is the useful part:
- Cheap and simple, with a wider error band. IEA puts the uncertainty of optical methods at around 4–7%, because they may use a different cover glass from the array and do not capture non-uniform soiling. It also says cell-cell and optical methods are the least costly, allow simple installation and multiple measurement points, and have little or no maintenance cost, and it stresses that these uncertainties are estimates.
- The dust matters. IEA notes that dust scattering properties vary with test location. The DustIQ is initially calibrated with Arizona quartz dust and, IEA says, should be recalibrated for site-specific conditions by letting local dust accumulate until the transmission loss is 5–10%.
- One wavelength is a simplification. Bessa et al. point out that these sensors assume soiling transmits evenly across the spectrum. It transmits less in the blue, so a single-wavelength reading can differ from the broadband loss, and different PV technologies respond differently.
- Field comparison. At Logan, Utah, from May 2019 to May 2020, three soiling stations and two optical sensors all separated high-soiling from low-soiling periods, with up to 2% errors in monthly soiling rate from the optical sensors and 1% from the stations. This is second-hand: Bessa et al. summarise it from a webinar.
- Angle of incidence. Wolfertstetter et al. (DLR, with Kipp & Zonen co-authors; abstract only) report that an optical sensor’s scattering signal does not depend on the sun’s position, while the soiling-induced power loss of PV reference cells follows an incidence-angle pattern. They propose a correction and write that without it daily power production “can be overestimated significantly”.
What the A60 page publishes
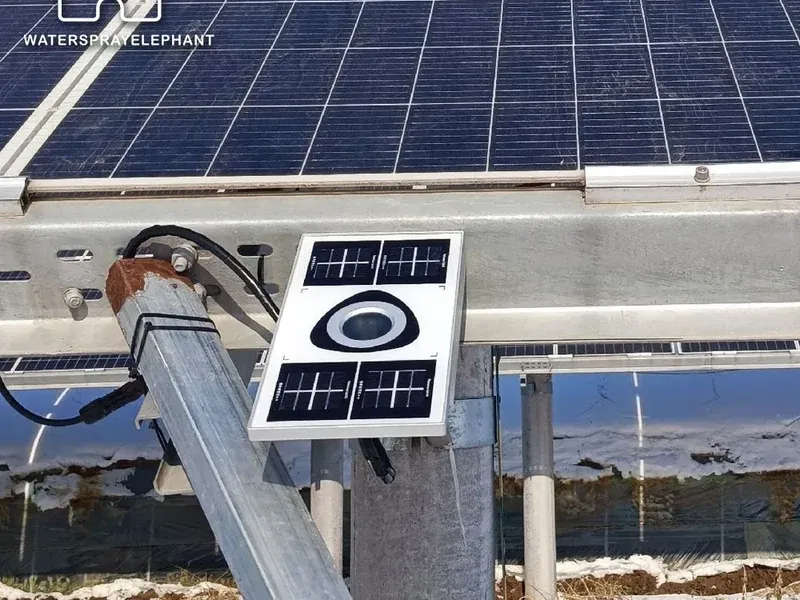
Our A60 PV Dust Measuring Instrument is an optical sensor, so everything above applies to it. Table 2 lists what its product page states, fetched on 26 October 2026, and what each line does and does not tell you. We quote only the page.
| Item | Published on the product page | What it tells you, and what it does not |
|---|---|---|
| Intended use | “Use it to monitor optical PV-glass cleanliness, not to directly measure energy loss.” | A cleanliness indicator. The page’s FAQ adds that energy impact also depends on irradiance, module behaviour and system conditions. |
| Principle | Optical scattering at the sensor surface; no moving parts | It falls in the optical class above, with that class’s assumptions about spectrum and dust type. |
| Measurement range | 100%–50% | A scale for glass cleanliness or soiling ratio. The page does not define the quantity further. |
| Accuracy | 100%–90%: 1%; 90%–80%: 2%; 80%–50%: 4% | The page does not say whether these are absolute or relative, or against what reference. They describe the instrument, not how well one sensor represents an array, so they cannot be compared with IEA’s 4–7% for optical methods, which includes the cover-glass and non-uniformity effects (our reading). |
| Stability | 1% per year | The page does not define it. Section 10 shows what it would mean if it is long-term drift of the reading. |
| Interface, power and housing | RS485 Modbus as standard, 4G optional; DC 8–24 V, below 2 W; IP67 aluminium, 252 × 137 × 35 mm, 1.3 kg; −40 °C to 70 °C, 0–100% RH | Fits a standard logger chain. The register map and output units are not on the page. |
| Calibration | Designed for installation without on-site calibration; maintenance and data validation should still follow the operating instructions | IEA advises recalibrating the DustIQ to local dust. That is another product, so it does not transfer automatically, but the dust dependence it points to is a reason to validate any optical sensor on your site. |
| Not stated on the page | Mounting height, tilt and orientation; output format and units; whether the reading includes a correction for sun angle | Get these from the datasheet or from us before you design a monitoring layout around the sensor. |
In short, the page describes a glass-cleanliness indicator with an instrument-level accuracy statement. Whether its reading tracks the energy loss on your array is something to establish at your site, as for any optical sensor, by comparing it against a power-based check (Section 8).
7. Method D: image-based measurement
Image-based methods estimate how much of the glass is covered by dirt and convert that to a loss. Bessa et al. describe three kinds: a camera-based optical sensor such as the Mars sensor above; a microscope that photographs the back of a glass coupon, which in one field study in Gandhinagar, India returned estimates within 1% of a commercial soiling station after an initial calibration; and aerial imaging by drone or satellite. Aerial imaging quantifies the area covered, can detect non-uniform soiling and may identify other defects, but is expensive or impractical if constant monitoring is required, and the effects of reflection, camera settings and shading are not yet clear. Our reading is that it is best used occasionally, to find where non-uniform soiling collects and where a point sensor should go. That is a judgement, not a finding from the review.
8. Where to put sensors, and how to validate them
A point sensor is only as good as the point. IEA reports that the relative power reduction within one plant varied from 0.89 to 0.95, and that deposition rates within a single site can differ by 1.5× to 2.0×, depending on prevailing winds and the distribution of dust sources. As summarised by Bessa et al., Gostein and co-authors found differences of up to 3% among strings and average soiling rates up to 2× apart within the same site at two California sites, higher near a farm along the wind direction, and a California study of 186 sites found rates differing up to 3× between sites.
- Match the array. Mount the sensor co-planar with the modules, at the same tilt and orientation. IEA notes that soiling losses typically fall as tilt increases, and that clean and soiled reference devices that are not co-planar add tilt and azimuth errors. The A60 page asks for representative mounting locations and for readings to be validated against the site plan.
- Use more than one on larger sites. IEC 61724-1 recommends more than one soiling sensor for sites above 5 MW with expected yearly losses above 2%. Bessa et al. report that the standard sets the number of soiling sensors equal to the number of irradiance sensors, from 1 to 8 depending on system size.
- Keep the irradiance sensors clean. IEC 61724 recommends cleaning them weekly. Every method that normalises by irradiance inherits their soiling.
- Read in a stable window and filter. Use readings within a few hours of solar noon and drop cloudy periods. Redondo et al. found that sensors needing a minimum irradiance performed poorly under cloud.
- Validate against power. Run Method B on modules near the sensor at three states: just after rain or cleaning, midway through a dry interval and just before you would clean. Compare the sensor’s reading with the power-based ratio. If they track each other you have an indicator you can trust at that site, and the gap gives you a site factor. If they diverge, find out why before you automate anything. This procedure is ours, not a standard.
- Repeat when conditions change. A new dust source, a change of season or a change of cleaning method can shift the relationship. Keep the validation log.
9. Why non-uniform soiling breaks the simple methods
Short-circuit current is a good stand-in for power only when all cells in a module are uniformly soiled. IEA explains the failure: when soiling is not uniform, a string of soiled cells can be bypassed by its diode, which removes power without changing the module’s short-circuit current. Isc-based readings then underestimate the loss. IEA therefore says electrical soiling stations should ideally collect both Isc and power.
The field evidence points the same way. Lorenzo, Moretón and Luque (2014; abstract only) studied a 2 MW PV plant in south-east Spain and report voltage losses from inhomogeneous dust that can be several times larger than the short-circuit ones, power losses much larger than module-by-module measurements suggest, and hot spots. Bessa et al. summarise the hot-spot result as temperature differences of more than 20° between soiled and unsoiled cells; the abstract itself gives no unit. Also as summarised by Bessa et al., power losses up to 10% higher than short-circuit current losses have been reported, and Gostein et al. (2015) found that soiling on the bottom-right corner of a module, covering 0.5% of its surface, caused a 9% power loss.
At Burgdorf the loss came from a strip of soiling about 1 cm thick along the lower edge of the modules, with losses up to 10% by spring 1998 (IEA; see our rain article for the site conditions).
What that means for each method:
- Reference cell, Isc-based: misses it, as a soiled reference cell does not develop the pattern.
- Optical sensor: reads one small piece of glass, so it does not see a pattern on the array.
- Yield extraction: includes it in total output but cannot say where it is or separate it from other losses.
- Power-based cleaning test: captures it for the modules tested.
If your array soils unevenly, for example along the lower edge or around droppings, include a power-based check in the plan, whichever continuous indicator you use.
10. From a reading to a cleaning decision
A soiling rate is most useful as an input to the cleaning interval. Ilse et al. (2019) give a cost-minimising interval for a linear soiling model. We used the same model in the robot payback article: n = √(730 × u / (Y × p × SR)), where n is days between cleanings, u is the cost of one cleaning per kWp, Y is specific yield in kWh/kWp·yr, p is the value of a kWh and SR is the soiling rate as a fraction per day. The soiling loss is then Y × p × SR × (n + 1) / 2 and the cleaning spend is u × 365 / n.
Basis for Table 3. A ground-mounted plant with Y = 1,400 kWh/kWp·yr, p = $0.035/kWh and u = $1.0/kWp per cleaning, the inputs of the ground-mount case in our cost model. Intervals are capped at one cleaning a year. These are orders of magnitude to show the logic, not a quote, and the model ignores rain, seasons and tilt.
| Soiling rate | Cleaning interval | Soiling ratio just before cleaning | Average soiling loss | Soiling plus cleaning, per kWp per year |
|---|---|---|---|---|
| Low (0.01%/day) | 365 days | 96.3% | 1.8% | $1.90 |
| Moderate (0.04%/day) | 193 days | 92.3% | 3.9% | $3.79 |
| High (0.1%/day) | 122 days | 87.8% | 6.2% | $6.01 |
| Very high (0.3%/day) | 70 days | 78.9% | 10.7% | $10.43 |
The “soiling ratio just before cleaning” column is the threshold a trigger-based schedule would use. At 0.04%/day, for example, the interval is 193 days and the trigger is a soiling ratio of about 92.3%. Whether the number comes from yield extraction, a validated optical sensor or a cleaning test, the sensor’s job is to supply the rate and to confirm that the threshold has been reached.
How accurate does the rate need to be? If the soiling rate used for planning is wrong by a factor f, the interval is wrong by a factor of 1/√f, and the extra soiling-plus-cleaning cost, as a fraction of the minimum, is (1/√f + √f) / 2 − 1. This is our own derivation from the formula above. It gives 0.6% extra for f = 1.25, 2.1% for 1.5, 6.1% for 2, 15.5% for 3 and 25% for 4, and the same values if the rate is too low by the same factor. Recomputing the 0.04%/day case exactly, without dropping the half-day term, changes these by less than 0.1 percentage point.
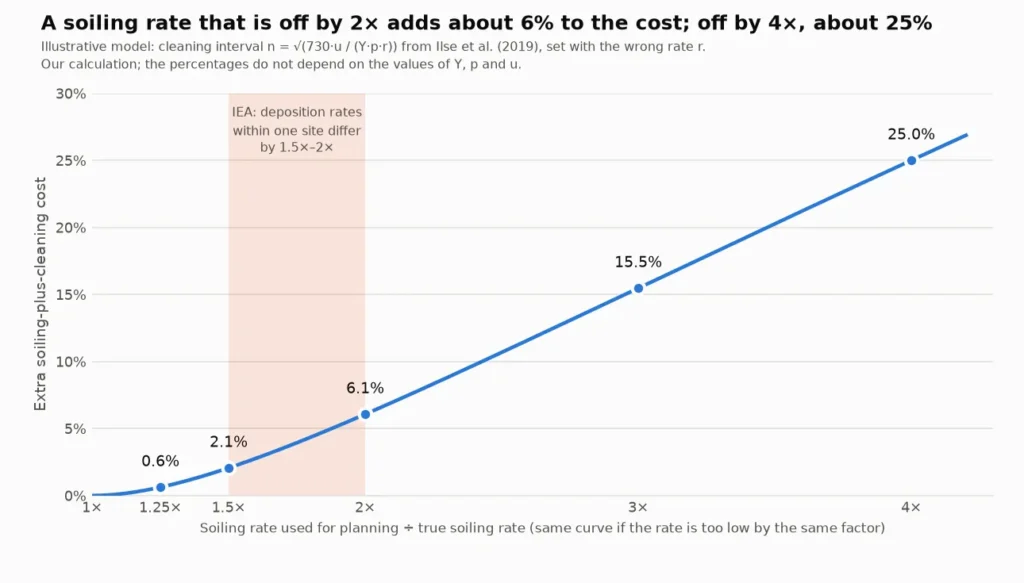
Two readings follow, both ours. A factor of 1.5 to 2 in the rate costs roughly 2% to 6% of a soiling-plus-cleaning cost of about $3.79/kWp·yr in the 0.04%/day case, which is the size of the within-site spread IEA reports. Where the sensor sits can therefore matter as much as the accuracy of its reading. And a factor of 4 costs a quarter, so a rate that is badly wrong matters far more than one that is a few percentage points off.
Drift is the other thing to check. A rate is a slope, so a constant offset in the reading does not change it, but a drifting sensor does. If the A60’s stability of 1% per year means long-term drift of the reading, which the page does not say, 1% over a year would be 27% of one year’s soiling signal at 0.01%/day, 7% at 0.04%/day, 2.7% at 0.1%/day and 0.9% at 0.3%/day. The same arithmetic applies to any sensor with that stability, so at low-soiling sites validation against a power-based check matters most.
11. Where eyes and output curves mislead
Two shortcuts are common, and the sources show why each fails on its own:
- Judging by eye. What you see is the pattern, not the loss. The Burgdorf strip was about 1 cm thick and went with losses up to 10%; the Gostein corner patch covered 0.5% of a module and cost 9% of its power (as summarised by Bessa et al.). Looking tells you where to measure, not how much.
- Reading daily output. Output follows irradiance first. Deceglie et al. work with a performance index, measured yield divided by modelled yield, and filter outages and clipping, because the raw kWh curve hides a slow soiling trend behind weather.
- Trusting a soiled irradiance sensor. Performance-ratio methods work only if the plane-of-array sensor is kept clean. IEC 61724 recommends weekly cleaning, and a study cited by IEA found soiling rates on pyranometers 50% lower than on modules, so an irradiance sensor and the array can soil at different rates.
- Reading a sensor after rain and assuming the array is clean. Rain removes loose dust, but several residues resist it (see our rain article). Until you have validated it against the array, a reading after rain is a statement about the sensor’s glass.
Frequently asked questions
How do you measure soiling loss on solar panels?
Compare the output of soiled modules with what they would produce clean. You can do that with a reference device kept clean, from the plant’s own yield data and a performance model, by measuring power before and after cleaning, or with an optical sensor or camera that estimates the effect from the dirt on a piece of glass. IEA’s uncertainty estimates run from about 1–2% for power measured on a reference module to 4–7% for optical methods.
What is the soiling ratio and how is it calculated?
It is the power of the array in soiling conditions divided by its power in clean conditions (IEC 61724). Most sensors approximate it as the ratio of the temperature-corrected short-circuit current of a soiled device to that of a clean one. The soiling loss is one minus the soiling ratio, so 0.95 means a 5% loss.
Can you measure soiling loss without a soiling station?
Yes: yield-based extraction such as the SRR method in RdTools, a before-and-after cleaning test, an optical soiling sensor, or image analysis. Table 1 sets out the trade-offs. None captures everything, and non-uniform soiling is the case that most often defeats the simple ones.
Is an optical soiling sensor accurate?
IEA estimates the uncertainty of optical methods at around 4–7% and says more studies are needed. In a Utah comparison summarised by Bessa et al., optical sensors had up to 2% error in monthly soiling rate against 1% for soiling stations. A manufacturer’s accuracy figure describes the instrument, not how well one sensor represents your array, so validate it on site.
How many soiling sensors do I need?
IEC 61724-1 recommends more than one for sites above 5 MW with expected yearly losses above 2%. Deposition rates within one site can differ by 1.5× to 2.0×, so smaller sites also benefit from validating at more than one place.
Does a soiling sensor measure energy loss?
An electrical station compares outputs, which is energy-based. An optical sensor measures light scattered or transmitted by its own glass and converts it to an equivalent loss. The A60 page states that it is for monitoring optical PV-glass cleanliness and not for directly measuring energy loss.
How long does it take to measure a soiling rate?
The literature calculates rates over periods of at least 14 days without a cleaning event. At low soiling rates that can mean weeks or months of data.
How do I turn soiling readings into a cleaning schedule?
Estimate the soiling rate, then choose the interval that balances soiling loss against cleaning cost. In the linear model of Ilse et al. the interval is √(730 × u / (Y × p × SR)) days, and a trigger-based schedule cleans when the soiling ratio reaches 1 − SR × n. In our example, 0.04%/day gives 193 days, and a rate wrong by a factor of 2 adds about 6% to the cost.
Sources
- IEA PVPS Task 13 — Soiling Losses: Impact on the Performance of Photovoltaic Power Plants (T13-21:2022) (soiling ratio and rate definitions, reference-device configurations, optical sensors, uncertainty estimates, performance-ratio method, site variability, Burgdorf case study)
- Deceglie, Micheli and Muller — Quantifying Soiling Loss Directly From PV Yield, IEEE Journal of Photovoltaics 8(2) (2018) (SRR method, validation at 11 US soiling stations, limits)
- RdTools documentation — rdtools.soiling.SRRAnalysis (input definitions for the open-source implementation)
- Bessa, Micheli, Almonacid and Fernández — Monitoring photovoltaic soiling: assessment, challenges, and perspectives of current and potential strategies, iScience 24(3) (2021), DOI 10.1016/j.isci.2021.102165 (taxonomy of methods, limits of optical sensors, IEC 61724-1 sensor numbers, within-site variability; Logan, Utah and Gostein results as summarised)
- Redondo, Platero, Moset, Rodríguez and Donate — Review and Comparison of Methods for Soiling Modeling in Large Grid-Connected PV Plants, Sustainability 16(24) (2024), 10998 (behaviour of two-panel soiling kits at 16 Spanish plants)
- Lorenzo, Moretón and Luque — Dust effects on PV array performance: in-field observations with non-uniform patterns, Progress in Photovoltaics 22(6) (2014), DOI 10.1002/pip.2348 (abstract only; non-uniform soiling, voltage losses and hot spots)
- Gostein, Düster and Thuman — Accurately Measuring PV Soiling Losses with Soiling Station Employing PV Module Power Measurements, IEEE PVSC (2015), DOI 10.1109/PVSC.2015.7355993 (not read in full; the 0.5% corner patch and 9% power loss are quoted as summarised by Bessa et al.)
- Wolfertstetter et al. — Incidence angle and diffuse radiation adaptation of soiling ratio measurements of indirect optical soiling sensors, Journal of Renewable and Sustainable Energy 13(3) (2021), DOI 10.1063/5.0048001 (abstract only; incidence-angle dependence of reference-cell and optical soiling readings)
- Ilse et al. — Techno-Economic Assessment of Soiling Losses and Mitigation Strategies for Solar Power Generation, Joule 3 (2019) (cost-minimising cleaning interval for a linear soiling model)
- WaterSprayElephant — A60 PV Dust Measuring Instrument product page (published specifications, intended use and FAQ; fetched 26 October 2026)