PV cleaning equipment manufacturer
PV cleaning equipment manufacturer


Does Rain Clean Solar Panels? Why Bird Droppings, Pollen and Cemented Dust Stay
Rain only partly cleans solar panels. What studies report for bird droppings, pollen and cemented dust, and what to check after rain.

The short answer
Rain removes part of the loose dust on a module, but no rainfall total has been shown to clean panels reliably, and several sticky residues are reported to resist rinsing: pollen, cemented dust, oily deposits and, in some studies, bird droppings. The literature review in a 2024 West Africa study (Norde Santos et al.) found that the rain treated as a “full clean” in models runs from 0.3–20 mm a day, and its authors wrote that no single threshold guarantees complete cleaning under all conditions and locations. At five North Carolina plants with average rain of 10.9–14.1 mm/day and dry spells of about 2 days, spring losses reached about 15% and did not recover with the rain; manual cleaning recovered 5–11%.
For “do I need to clean if it rains?”, the practical reading is that rain postpones the need to look, not the need to check. Section 1 sets out what each kind of residue does after rain, Section 4 explains why a small patch can cost more than its area suggests, and Section 8 shows why the published loss numbers cannot be added together.
Scope and disclosure. This article covers what rain does and does not remove. How often to clean by climate is in How Often Should You Clean Solar Panels?, method choice in Dry vs Wet Solar Panel Cleaning, water quality in Can You Clean Solar Panels With Tap Water?, prices in How Much Does Solar Panel Cleaning Cost?, and robot payback in Are Solar Panel Cleaning Robots Worth It?. WaterSprayElephant makes PV cleaning equipment. Every figure below comes from a third-party study or report, named with its source; we ran no tests of our own. Where sources disagree we say so, and we leave out figures we could not trace to a primary source. Units are metric (1 mm of rain is 1 litre per m²); the article contains no prices.
1. Rain and five kinds of soiling at a glance
Table 1 summarises what the sources we read report for each kind of residue. The right-hand column matters as much as the middle one: several of the findings come from a single site, and some are summaries of other studies that we did not read in the original.
| Soiling | What the sources report about rain | Where it comes from | Limits |
|---|---|---|---|
| Loose dust | Rain usually cleans it in part. Thresholds used to model a full clean run 0.3–20 mm/day. | Review in Norde Santos et al. 2024, plus their own data from 33 stations in West Africa | That dataset was mostly dust at 8–18° tilt. |
| Bird droppings | Sources conflict. A Phoenix study: 5 mm of rain roughly halved soiling losses except with droppings present. A Navarra (Spain) study: rain above 4–5 mm/day cleaned modules considerably, including removing dirt such as droppings. | Both as summarised by Norde Santos et al. 2024; hardening of dried droppings from Fodah et al. 2024 | We did not read the two original studies. Fodah et al. did not test rain. |
| Pollen | Reported as rain-resistant: no clear recovery even at up to 50 mm/day; manual cleaning recovered 5–11%. | Bessa et al. 2024, five utility-scale plants in North Carolina | Cause attributed “at least partially” to pollen by O&M reports; the authors had no site pollen counts. |
| Cemented dust | Dew or high humidity dissolves the soluble part of dust; on drying it leaves crystalline bridges to the glass and adhesion rises. In one hyper-arid study, water-based cleaning restored 99.9% of performance and dry cleaning left residues. | IEA PVPS Task 13 report T13-21:2022; Olivares et al. (abstract only) | The mechanism is described for dew and humidity, not for rain. The Atacama result is from a hyper-arid site. |
| Oily films, resins, brake dust | Described as more resistant to cleaning than ordinary dust; oily substances and resins are not completely removed by rain. | Norde Santos et al. 2024 | A qualitative statement; the paper’s own data were mostly dust. |
2. How much rain counts as clean? The literature does not agree
Soiling models usually need a rule for when rain resets a module to clean. Norde Santos et al. (2024, DLR and CIEMAT) open their experimental study with a review of the rules in use (“the review” below) and find thresholds from 0.3–20 mm of daily rain. They also write that most studies show rain often cleans only partly, reducing losses without removing them, and that no single threshold guarantees complete cleaning under all conditions and locations. Figure 1 plots the thresholds they summarise.
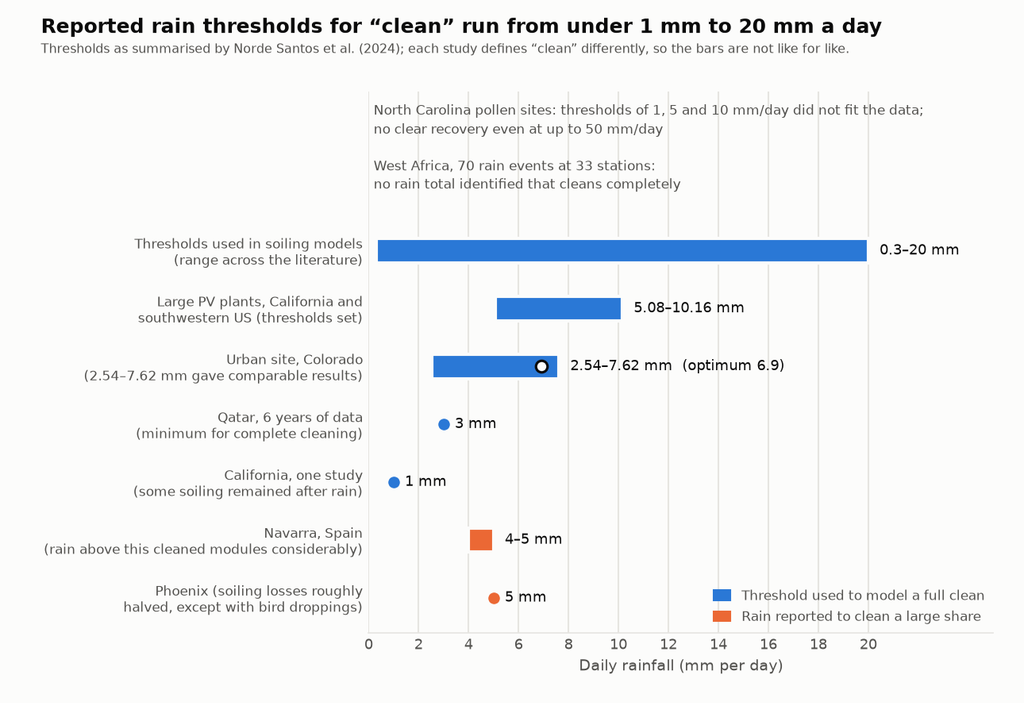
Three reasons the numbers differ are visible in the sources. The studies define “clean” differently: a threshold for a full clean in a model is not the same claim as rain that “considerably cleaned” modules. The soiling differs: the review’s authors note that droppings, brake dust, industrial emissions and pollen are more resistant to cleaning than ordinary dust. And tilt differs: the Navarra authors, as summarised in the review, found rain less effective on horizontal surfaces than on inclined ones. Even among the studies that set a threshold, the review reports that in the southwestern US work several rainfalls above 5 mm did not totally clean the systems, and that a California study with a 1 mm threshold found some soiling remained after rain.
The authors’ own data point the same way. They analysed 70 rain events at 33 stations in West Africa (tilt 8–18°, mostly dust) and could not identify a rain total that cleans completely. Modules were dirtier after rain in only 4 events, all of 0.2 mm or less. Below a rain sum of 1.95 mm, a cleaning completeness above 0.8 (on a scale where 1 is a full clean) was unlikely, and they found no clear link between cleaning and rain intensity or tilt within that range. Our reading is that a threshold is best treated as a property of a site and its soiling, not as a constant you can copy from a paper.
3. Bird droppings: a conflict in the rain evidence, and a hard residue once dry
Two of the studies in Section 2 disagree about droppings. In the review’s summary, the Phoenix work found that 5 mm of rain roughly halved soiling losses except where droppings were present, while the Navarra work reported that rain above 4–5 mm/day cleaned the modules considerably and removed dirt such as droppings. We did not read either original, so we cannot say why they differ. One factor we would check, and which neither summary addresses, is how long the droppings had dried before the rain arrived.
What droppings do to output is better documented. Fodah et al. (2024, MRS Energy & Sustainability) tested 260 W multi-crystalline modules (164 × 99.5 cm) in Cairo on cloudless days from 9 am to 3 pm. The researchers applied guano to simulate natural droppings; each drop spread to 12–15 cm, about 50 cm². They compared one, two, three and four drops with a clean control module.
| Module condition | Power at about 11 am (W) | Change versus clean |
|---|---|---|
| Clean (control) | 283 | – |
| 1 drop | 282 | −0.4% |
| 2 drops | 283 | 0% |
| 3 drops | 275 | −2.8% |
| 4 drops | 213 | −24.7% |
The jump between three and four drops is the point. The preprint’s own summary for four drops is a 25–26% fall in power and a 36–38% fall in current (the table above is one hour, 11 am), while one to three drops had little or only a slight effect. By our arithmetic, four drops of about 50 cm² cover roughly 1.2% of the 16,318 cm² module face. The preprint does not say where on the module the drops were placed or how many cells they covered, and it does not explain the jump. Section 4 gives one mechanism that could produce a jump like this; the study did not test it.
On what the residue is: the authors measured guano pH at 3–4.5 and state that once the hydrated material dries in the sun it hardens and becomes difficult to remove from the glass. We found no measured rate of glass or coating damage from droppings, so we do not quote one. The study also reports temperature effects, but its abstract and its preprint disagree on direction, so we use none. A separate study in Western Rajasthan (Sisodia and Mathur, 2019, abstract only) reports that dropping-related power loss was highest in March and lowest during the August rainfall, and that it depended on tilt. That fits rain reducing the effect of droppings, but the abstract gives no rainfall figures, so it does not settle the conflict above.
4. Why a small patch can cost more than its area
A crystalline-silicon module is built from cells wired in series. PVEducation describes what happens when one cell produces less current than the others, for example because it is shaded: the cell can be pushed into reverse bias, the maximum power dissipation in the shaded cell is approximately equal to the generating capability of all cells, and the resulting hot-spot heating can be destructive. A bypass diode, wired in parallel with opposite polarity, conducts when a cell is reverse biased, so current flows around the poor cell and the reverse voltage across it falls to about one diode drop.
The IEA PVPS Task 13 soiling report connects this to soiling: non-uniform soiling can cause a power loss out of proportion to the change in short-circuit current, reduce the fill factor and potentially lead to hot spots that permanently damage cells. The same report notes that soiling tends to collect in the lower parts of modules, and the Task 13 report on module service life lists non-uniform dust accumulation among the causes of hot-spot formation and bypass-diode failure.
We found no primary-source temperature for a soiling-induced hot spot, so we give none; vendor articles quote figures that we could not trace. Whether a given patch of droppings or pollen reaches that point depends on the module, how its strings and diodes are laid out, and where the residue falls. Our reading is that this mechanism is a plausible reason for the three-to-four-drop jump in Section 3, but that study did not test it. The Burgdorf case in Section 7 is a real-array example of localized soiling with a large effect: a narrow strip of residue along the lower frame edge was associated with a loss of up to 10%.
5. Pollen: rain-resistant soiling in a wet climate
Bessa et al. (2024, IEEE Journal of Photovoltaics) studied five utility-scale plants in North Carolina. The region has high rainfall, with average rain of 10.9–14.1 mm/day and dry spells of only about 2 days, so the authors expected minimal soiling. Instead, performance fell each spring, with losses reaching up to 15%, and rain did not bring it back quickly. At site A the system took about 4 months to climb gradually back to its summer peak, and a manual cleaning by the O&M team in summer 2022 recovered 5% even though regular rain was falling around that time. Across the five plants, manual cleaning recovered 5–11%.
The rainfall pattern showed low correlation with when soiling built up or recovered. At site A the authors could not tie recoveries to rain above any threshold: they expected positive shifts at thresholds of 1–10 mm/day, but saw no clear recovery even on days with rain as heavy as 50 mm. The models they tested, which assume an abrupt cleaning after each significant rain, did not describe these sites. At site A, a fixed-rain-threshold model tested at 1, 5 and 10 mm/day detected losses of at most 5%, against a maximum actual loss of 15%. Mean relative humidity at the five sites was 77%.
The caveats are the authors’ own. The cause is attributed “at least partially” to pollen on the basis of O&M reporting and site observation, not a measured pollen load, and the paper recommends further studies with precise pollen data; glass coupons have been deployed at one site for future work on individual pollen grains. We would not read the 15% as a pollen-only number. It does show what a wet climate can still do: the authors conclude that sites conventionally seen as “clean” because of rain can suffer substantial losses.
6. Cemented dust and oily films
The IEA PVPS Task 13 report describes how dust that rinses off easily can turn into dust that does not. Where humidity is high or the glass is below the dew point, the soluble fraction of deposited dust (salts, minerals such as gypsum) is partly or completely dissolved by water on the surface. When the film dries, the dissolved material precipitates and forms solid crystalline bridges between the undissolved particles and the glass, and adhesion increases. The report adds that adhesion forces can rise significantly after drying even without visible dew, because thin water films form between particles and glass at low relative humidity. The report names 2–63 µm particles as the main contributors to soiling in arid regions and says that such particles are normally water-soluble and can be removed relatively easily, but that under high humidity with phases of dryness, adhesion can increase greatly and require professional cleaning.
Olivares et al. (Renewable Energy, 2026, abstract only) studied cemented soiling in the Atacama Desert, driven by gypsum recrystallization. Their abstract reports an estimated annual energy loss of about 9.8% for a plant, that water-based methods restored 99.9% of performance, and that dry methods left residues that promote recrystallization. Two cautions: this is an estimate whose method the abstract does not give, and a hyper-arid site is not a rainy one. The IEA text discusses dew and humidity rather than rain, so applying it to rain is our reading: a light rain that wets dust without rinsing it away is a wet-and-dry cycle of the kind these mechanisms describe.
For oily and resinous deposits we found no loss figures. Norde Santos et al. state that most soiling types on PV modules and other glass surfaces are not completely removed by rain alone, which they flag as especially important for oily substances and resins, and they list brake dust and industrial emissions among the residues more resistant than ordinary dust. The paper gives no loss figures for them either. For a site beside a railway or a busy road, that is a reason to look at the glass rather than assume.
7. A rainy-climate case: Burgdorf, Switzerland
The IEA PVPS Task 13 soiling report includes a long-term case that tests the assumption that rain keeps panels clean. The Bern University of Applied Sciences PV laboratory in Burgdorf runs a 60 kWp array of 1,056 framed modules, tilted 30° with the long side horizontal, on a roof about 10 m above ground. Natural rainfall there is more than 1,000 litres per m² a year and spread across the year, and natural cleaning was considered sufficient before installation.
Only spring pollution was visible in 1994–1996. After a rather dry and sunny spell from the end of July to early November 1997, a permanent strip of dirt formed close to the lower edge of the module frame (the report describes compact pollution up to 1 cm, followed by a strip of visible but less compact pollution). Because the cells sit only 1–2 mm from the frame, the strip hit the horizontal-long-side modules hard, and a loss as high as 10% had built up by spring 1998. Until then only the irradiance sensors had been cleaned, not the modules. A periodic cleaning schedule followed, and string IV measurements before and after each cleaning on the 30 kWp part of the array gave the gains in Figure 2.
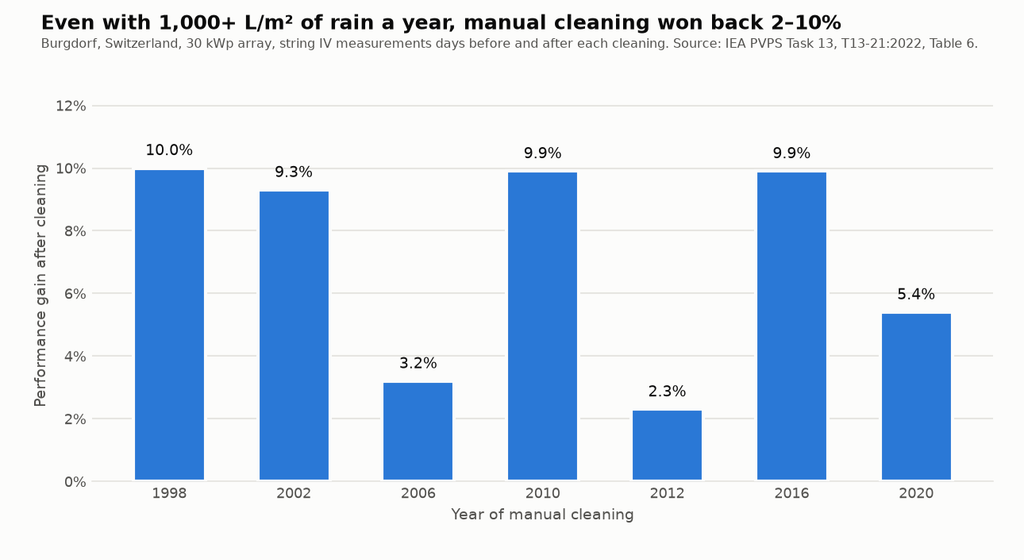
Gains ranged from 2.3% to 10% depending on weather and the state of the array. From 2012 on, the monitoring data showed no longer-lasting gain: the modules appeared to return faster to an equilibrium level of soiling, which the report suggests could be due to ageing of the glass surface or inadequate cleaning. The IEA draws a general conclusion from the case: soiling can build up slowly even where natural cleaning is frequent, so annual or at least periodic manual cleaning should be carried out to remove hard-to-remove soiling and to prevent hard bonds forming between soiling and the module surface.
Two limits belong with this case. The site is not a clean test of rain on dust: the report describes light industry, forest and farms around the town, with pollen especially in spring, and a railway line less than 100 m away where trains brake and accelerate. It does not separate the composition of the strip. And it is one array with one geometry: the horizontal long side and the 1–2 mm cell-to-frame distance are part of why the strip mattered so much. The report notes elsewhere that frameless modules may make it easier for soiling to be removed.
8. What the published numbers measure, and why they cannot be added up
Table 3 sets the loss figures from the sections above side by side with the way each was obtained. They answer different questions, so neither a total nor a ranking follows from them.
| Study | Residue | Reported effect | How it was obtained | Why it does not combine with the others |
|---|---|---|---|---|
| Fodah et al. 2024 | Bird droppings, applied by the researchers | Power −25–26% and current −36–38% with four drops | Outdoor test, one module per condition, Cairo, cloudless days, 9 am–3 pm | A short-term test on one module type, not a loss over a season. |
| Bessa et al. 2024 | Pollen, partly (per O&M reports) | Spring losses up to about 15%; manual cleaning recovered 5–11% | Estimated from operating data of five utility-scale plants | The cause is not isolated and no pollen counts were available. |
| Olivares et al. 2026 | Cemented gypsum crusts | About 9.8% estimated annual energy loss | An estimate stated in the abstract; the method is not in the abstract | A hyper-arid site and an estimate, not a measured loss. |
| IEA T13-21, Burgdorf | A mixed residue strip (pollen, brake dust and other; not separated) | Up to 10% loss by spring 1998; cleaning gains of 2.3–10% | String IV measurements days before and after each cleaning, 30 kWp | One array with an unusual geometry; the gain is measured around a cleaning, not over a year. |
A short test on one module, an operating-data estimate, a stated estimate and a before-and-after measurement do not share a baseline, so we do not turn them into a single “loss from stubborn residue” figure. The same reasoning is why published soiling numbers appear to contradict each other, as the frequency guide explains.
9. What to do after rain
These steps follow from the evidence above. Where a step is our judgement rather than a sourced finding, we say so.
- Do not count rain as a cleaning in your schedule until you have measured it at your site. The thresholds in Section 2 run from 0.3–20 mm/day and are site-specific. A before-and-after comparison of output, or a soiling sensor, is how you set your own; the frequency guide covers how to compare without being misled by weather. (Our judgement, based on Section 2.)
- Look at the glass after rain, not only at the output. Check the lower edge of each module, where the IEA report says soiling tends to collect, and look for spots and films that rain has not moved. A narrow band along the frame is how the Burgdorf loss showed up.
- Deal with droppings and pollen early. Fodah et al. describe dried guano as hard to remove, and the IEA recommends periodic manual cleaning to prevent hard bonds forming. Our reading is that removal is easier before the residue has dried and aged.
- For mineral crusts, compare water-based and dry cleaning on a few modules first. The Atacama abstract reports water-based cleaning restoring 99.9% of performance and dry cleaning leaving residues that promote recrystallization. That result is from one hyper-arid site, so treat it as a reason to test, not a rule; our dry versus wet guide covers the trade-offs.
- Mind the water you clean with. A wash with hard water can leave its own mineral spots; see the water-quality guide for the TDS tiers.
- Keep a log. Date, rain total, what you saw, and output before and after. Over a season that is the nearest thing to your own rain threshold.
For local spots that a whole-array wash would be too much for, one option is our G2 single-head cleaner. The product page describes the series as designed for relatively thick dust, bird droppings and other stubborn local soiling, with a 32 cm head, a telescopic pole of 3.5, 5.5 or 7.5 m and a published maximum water flow of 4 L/min, recommended for projects of about 100–500 m². These are manufacturer-published figures. We have no test data linking the G2 to any result in this article, and nothing here claims it removes a particular residue.
Frequently asked questions
Does rain clean solar panels?
Partly, for loose dust. The review in Norde Santos et al. (2024) found thresholds for a full clean from 0.3–20 mm a day, and its authors wrote that no single threshold guarantees complete cleaning. Pollen and oily deposits are reported to resist rain, cemented dust is described as hard to remove once it has formed, and the evidence on bird droppings conflicts.
How much rain does it take to clean solar panels?
There is no figure that holds everywhere. Models use thresholds between 0.3–20 mm/day; individual studies report at least 3 mm for complete cleaning (Qatar), more than 4–5 mm for considerable cleaning (Navarra) and 5.08–10.16 mm as set thresholds for large US plants; and a West Africa dataset of 70 rain events found no total that cleans completely. In the North Carolina pollen study there was no clear recovery even at up to 50 mm/day.
Does rain remove bird droppings from solar panels?
The sources conflict. As summarised in the review, a Phoenix study found 5 mm of rain roughly halved soiling losses except where droppings were present, while a Navarra study found rain above 4–5 mm/day cleaned modules considerably and removed dirt such as droppings. The review’s authors list droppings among the residues more resistant to cleaning than ordinary dust, and a Cairo study describes dried guano as hard to remove. Inspect your own modules after rain.
Does rain wash pollen off solar panels?
Not reliably in the one study we found. At five North Carolina plants, spring losses reached about 15%, recovery was slow and uncorrelated with rain, and manual cleaning recovered 5–11%. The authors attribute the behaviour at least partly to pollen, based on O&M reports rather than pollen counts.
Can rain make solar panels dirtier?
Light rain can. In the West Africa dataset, modules were dirtier after rain in 4 of 70 events, all with 0.2 mm or less, and the review reports a southwestern US study in which light rain left modules dirtier.
Can bird droppings damage solar panels?
The study we found measured output, not damage: four applied droppings cut power by 25–26% while on the module. The IEA lists non-uniform dust accumulation among the causes of hot-spot formation and bypass-diode failure. We found no measured rate of glass or coating damage from droppings, so we do not quote one.
What is cemented soiling?
Dust whose soluble part has been dissolved by dew or high humidity and then dried into crystalline bridges to the glass, which raises adhesion so that it no longer rinses off easily. The IEA PVPS Task 13 report describes the mechanism, and an Atacama Desert study links cemented deposits to gypsum recrystallization.
Do I need to clean my panels if it rains a lot?
Check rather than assume. At Burgdorf, Switzerland, with more than 1,000 L/m² of rain a year, manual cleaning still gained 2.3–10% each time, and the IEA recommends at least periodic manual cleaning. That is one array beside a railway; your own before-and-after comparison is the better guide.
Sources
- Norde Santos et al. — Cleaning of Photovoltaic Modules through Rain: Experimental Study and Modeling Approaches, Solar RRL (2024), DOI 10.1002/solr.202400551 (review of rain thresholds; 70 rain events at 33 West African stations; statements on resistant soiling types)
- Bessa et al. — An Investigation on the Pollen-Induced Soiling Losses in Utility-Scale PV Plants, IEEE Journal of Photovoltaics (2024) (five North Carolina plants; spring losses, recovery, manual cleaning, rain thresholds)
- Fodah et al. — Performance evaluation of solar photovoltaic panels under bird droppings accumulation using thermography, MRS Energy & Sustainability (2024) (abstract; effect of one to four applied droppings)
- Research Square preprint of the Fodah et al. study (rs-3179348, v1, CC BY 4.0) (module specification, drop size, hourly power, guano pH, hardening of dried droppings)
- Sisodia and Mathur — Impact of bird dropping deposition on solar photovoltaic module performance: a systematic study in Western Rajasthan, Environmental Science and Pollution Research 26 (2019) (abstract only; seasonal pattern of dropping losses, tilt dependence)
- IEA PVPS Task 13 — Soiling Losses: Impact on the Performance of Photovoltaic Power Plants (T13-21:2022) (cementation and capillary aging, non-uniform soiling, Burgdorf case study and Table 6)
- IEA PVPS Task 13 — Service Life Estimation for Photovoltaic Modules (T13-16:2021) (non-uniform dust accumulation listed with hot-spot formation and bypass-diode failure)
- Olivares et al. — Soiling in the Atacama Desert: Impacts on solar performance and evaluation of cleaning techniques, Renewable Energy 257 (2026), 124815 (abstract via the open-access Zenodo record; cemented gypsum deposits, water versus dry cleaning)
- PVEducation — Bypass Diodes (reverse bias in a series string, hot spots, how a bypass diode limits reverse voltage)